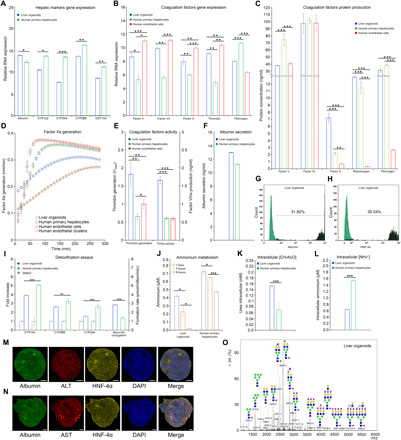
Fig. 2. Functional characteristics of liver organoids.

Real-time PCR measurements of (A) hepatic markers and (B) coagulation factor markers. (C) ELISA measurements of coagulation factor markers. (D) Factor Xa generation assay. HPH (green) and HAMEC (red) in 2D culture showed similar curve slopes, while 3D culture of HAMEC (brown) and liver organoids (blue) exhibited same slope pattern. The maximum rate of reaction Vmax of liver organoids (0.26) was lower than all positive controls (HPH, 0.40; HAMEC 2D, 0.41; HAMEC 3D, 0.33), indicating better enzymatic activity of organoids. (E) Thrombin generation assay and factor VIIIa activity displayed better results in organoids when compared with HPH and HAMEC. (F) ELISA measurement of albumin in liver organoids showed comparable results with HPH (13.05 ng/ml versus 11.30 ng/ml, respectively). (G) Fluorescence-activated cell sorting (FACS) analysis of albumin. (H) FACS analysis of HNF-4α. (I) CYP450 liver detoxification I analysis (induction of CYP450 showed doubled activity after drug administration in CYP1A2 and CYP2B6) and resorufin conjugation for liver detoxification II analysis (resorufin formation rate was statistically higher than HPH). (J) Ammonium metabolism assay. (K) Intracellular urea concentration analysis. (L) Intracellular ammonium concentration analysis. (M and N) Immunofluorescence of hepatic markers. Scale bars, 50 μm. (O) Glycan profile for mature liver organoids. Data are presented as means ± SD (n = 3). *P < 0.05, **P < 0.01, and ***P < 0.001.
