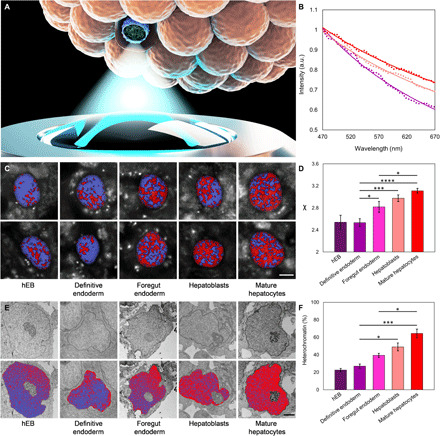
Fig. 6. Chromatin packing in live organoids at different stages of differentiation.

(A) Rendering of the measurements of chromatin packing within one of the nuclei in live differentiating hiPSC organoids using the CLASS microscope. (B) Average light scattering spectra collected with CLASS microscope for hiPSC organoids. Purple dots show spectra of chromatin at definitive endoderm stage (n = 19), pink at hepatoblasts stage (n = 21), and red at mature hepatocytes stage (n = 24). Model fits are presented with solid lines. (C) Spatial maps of fractal packing density of chromatin χ in live hiPSC organoids at different stages of differentiation. Two typical maps per stage overlaid over white light reflectance images of nuclei are shown. Values of χ in the range of 2.3 to 2.9 are shown as shades of purple and can be loosely associated with euchromatin, while values in the range of 2.9 to 3.5 are shown as shades of red and can be associated with heterochromatin. Scale bar, 5 μm. (D) Parameter χ reflecting changes in the heterochromatin to euchromatin ratio and SEs for hEB (n = 9), definitive endoderm (n = 19), foregut endoderm (n = 21), hepatoblasts (n = 21), and mature hepatocytes (n = 24) stages of differentiation. (E) Representative TEM images of nuclei in hiPSC organoids at different stages of differentiation. Top row: Original images. Bottom row: Same images overlaid with pseudo-color maps with heterochromatin highlighted in red and euchromatin in purple. Scale bars, 2 μm. (F) Percentage of heterochromatin at hEB (n = 4), definitive endoderm (n = 4), foregut endoderm (n = 3), hepatoblasts (n = 3), and mature hepatocytes (n = 3) stages of differentiation. Data are presented as means ± SEM. Statistical significance was evaluated with a Tukey’s multiple comparison test. *P < 0.05, ***P < 0.001, and ****P < 0.0001.
