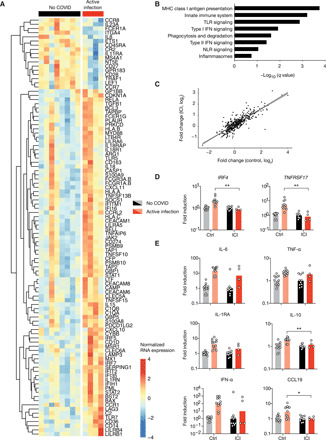
Fig. 1. Patients treated with checkpoint inhibitors display typical transcriptomic and proteomic inflammatory response during active COVID-19.

(A to C) Whole-blood transcriptomic profile of active COVID-19 patients and healthy controls from a cohort of nonmelanoma patients and a cohort of anti-PD-1–treated patients. (A) Heatmap representation of the 100 most differentially expressed genes between COVID-19–infected and uninfected patients of the anti-PD-1–treated cohort. (B) GSEA of pathways enriched during active COVID-19 in the PD-1–treated cohort. (C) RNA expression fold change between COVID-19 and uninfected patients in each cohort. Each point represents one gene. (D) RNA expression data from patients from both cohorts, normalized in each cohort to the mean of the uninfected group. (E) Proteomic data from patients from both cohorts, normalized as in (D). Each point corresponds to one patient, and bars represent mean value. Significance was determined using unpaired t tests. *P < 0.05 and **P < 0.01. MHC, major histocompatibility complex; TLR, Toll-like receptor; NLR, NOD-like receptor.
