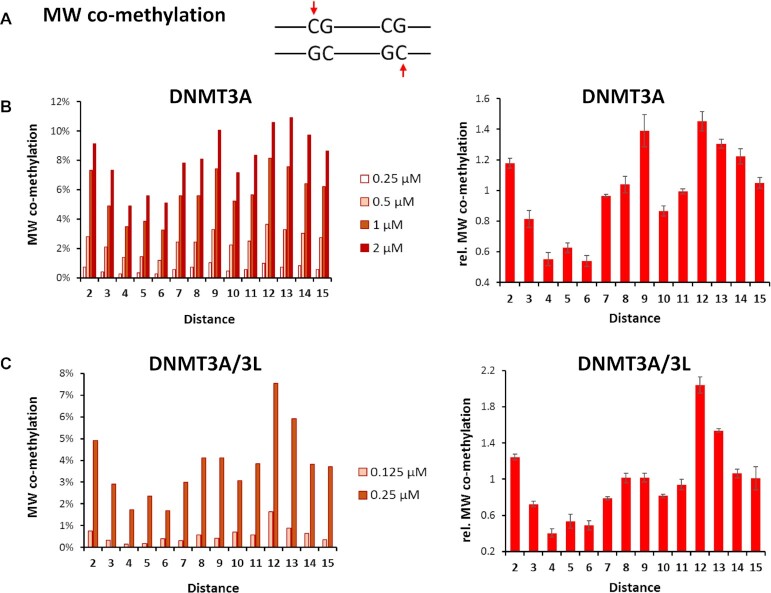
Figure 2.
Frequencies of MW co-methylation of CpG sites in variable distances observed with DNMT3A and DNMT3A/3L. (A) Scheme of MW co-methylation (B) Frequencies of MW co-methylation of CpG sites in variable distances observed with DNMT3A. The left panel shows the four independent data sets, the right panel shows averages and SEM obtained after normalization of the data sets to their average values. (C) Frequencies of MW co-methylation of CpG sites in variable distances observed with DNMT3A/3L. The left panel shows the two independent data sets, the right panel shows averages and SEM obtained after normalization of the data sets to their average values.

