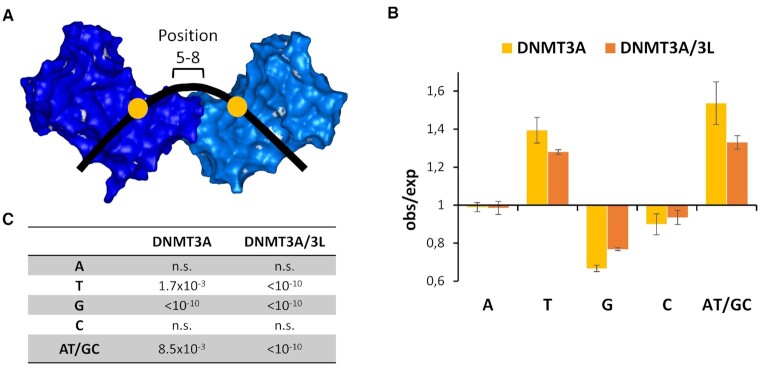
Figure 4.
Observed/expected frequencies of bases at the center of bending in MW co-methylated substrates with CpG sites in 12 bp distance. To analyze the DNA sequence at the center of bending positions 5–8 were considered. (A) Schematic view. (B) Averages of the enrichment and depletion of bases in substrates co-methylated by DNMT3A and DNMT3A/3L. Error bars display the SEM. (C) P-values of enrichment or depletion. P-values for a significant deviation from 1.0 were calculated using the averages and SD values with Z-statistic.

