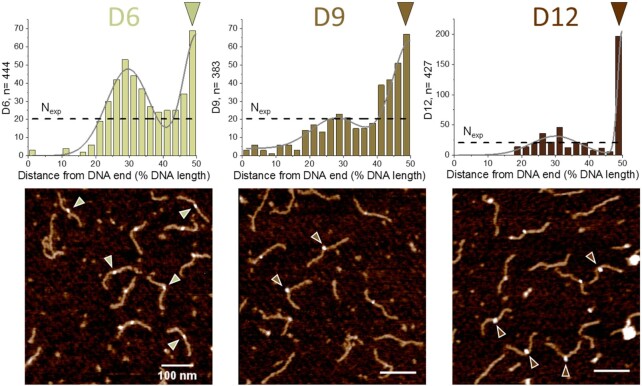
Figure 5.
SFM imaging of DNMT3A/3L binding preferences for pairs of CpG sites separated by 6, 9 and 12 bp. Position distributions of protein complexes bound to DNA substrates containing two CpGs with different spacings at 50% of DNA length: 6 bp (D6 substrate), 9 bp (D9 substrate), 12 bp (D12 substrate). Since the two DNA ends are not distinguished in our substrates, position distributions are plotted to 50% of DNA length (with distances measured for each protein peak to the closer end of the DNA). Protein positions were fitted with two normal distributions to highlight the bimodal distribution. Nexp (horizontal dashed lines) indicates the expected number of binding events in each binning interval assuming equal binding probability to all positions on the DNA substrates, i.e. complete lack of specificity. The triangles indicate exemplary complexes bound at the center of the DNA fragments (corresponding to the positions of CpG pairs with 6–12 bp spacing).

