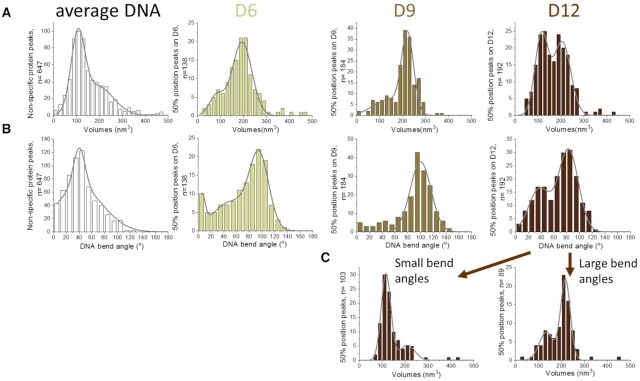
Figure 6.
Characterization of DNMT3A/3L complexes with CpG containing DNA substrates by SFM imaging. (A) Protein complex volumes and (B) DNA bending angles in the complexes situated at 50% of DNA length on substrates containing a pair of CpG sites separated by 6 bp (D6 substrate), 9 bp (D9 substrate), and 12 bp (D12 substrate). Average DNA refers to complexes formed at other sites (between DNA ends and 40% DNA length). (C) Separate volume distributions for species with moderate (∼40°, left) and strong DNA bending (∼80°, right) for the D12 substrate.

