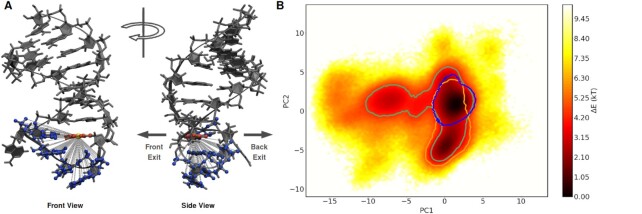
Figure 2.
(A) Front and side view of Gb-II riboswitch with 85 selected internal distances (dashed lines) used as CVs for dimensionality reduction with PCA. These include all distances between the non-hydrogen atoms of residues A9, C10, G11 and C13 (blue) to the center of mass (gold) of the nucleobase atoms of residue G8 (red). Atoms of the aptamer not used for CV selection are represented in dark grey. Arrows indicate the direction of a possible front and back exit out of the binding pocket. (B) Projection of the structures from MD simulations of all systems onto the first two PCs; displayed as estimate of the free-energy difference (ΔE = −ln ρ, where ρ is a probability density). Contour lines: regions visited by simulations with guanidinium (blue), urea (green) and without ligand (gold). Contour lines were drawn with a ΔE = 6 kT to the deepest minimum of the respective separate projection of each system.

