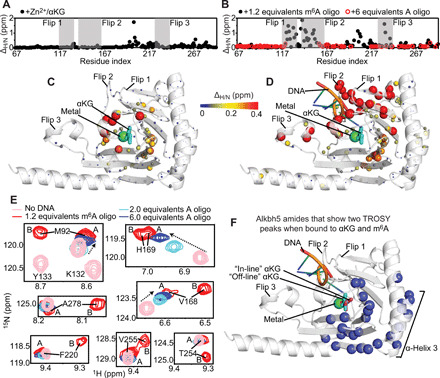
Fig. 3. Solution NMR of human Alkbh5.

(A) ΔH/N’s induced by a saturating concentration of Zn2+ and αKG on the 1H-15N TROSY spectrum of Alkbh5 are plotted versus the residue index. (B) The ΔH/N’s measured upon addition of 1.2 equivalents of 5′-GG(m6A)CT-3′ (black circles) or 6 equivalents of 5′-GGACT-3′ (red circles) to Alkbh5-αKG are plotted versus the residue index. Flips 1, 2, and 3 are highlighted by gray boxes. (C) ΔH/N’s induced by addition of Zn2+ and αKG to Alkbh5 are plotted on the structure of Alkbh5. (D) ΔH/N’s induced by addition of 5′-GG(m6A)CT-3′ to Alkbh5-αKG are plotted on the structure of Alkbh5. The relationship between ΔH/N and sphere color and size is depicted by the color bar. (E) Selected region of the 1H-15N TROSY spectrum showing the splitting of some NMR resonances into two peaks upon addition of 5′-GG(m6A)CT-3′. The spectrum acquired in the absence of DNA (but in the presence of Zn2+ and αKG) is colored pink. The spectrum measured at a saturating concentration of 5′-GG(m6A)CT-3′ is colored red. Spectra acquired at 1 mM and 3 mM 5′-GGACT-3′ are colored cyan and blue, respectively. The NMR peaks assigned to states A and B are labeled on the NMR spectra of the Alkbh5-αKG/m6A complex. Populations of 51 ± 10 and 49 ± 10% were calculated for states A and B, respectively, from integration of the NMR cross peaks. (F) The 28 residues for which two separate NMR correlations are detected in the 1H-15N TROSY spectrum of the Alkbh5-αKG/m6A complex are shown as blue spheres on the structure of Alkbh5.
