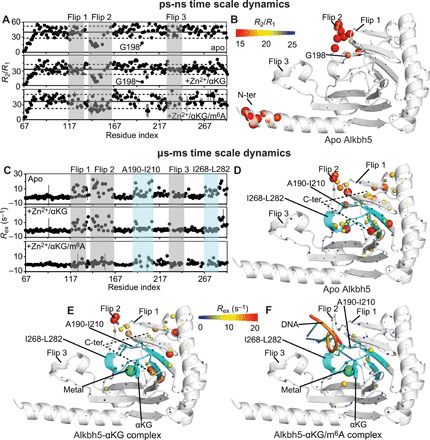
Fig. 5. Dynamics of Alkbh5 and its complexes.

(A) The 15N-R2/R1 ratios measured for apo Alkbh5 (top), Alkbh5-αKG (middle), and Alkbh5-αKG/m6A (bottom) are plotted versus the residue index. The localization of flips 1, 2, and 3 is shown by transparent gray boxes. The average R2/R1 value in each panel is indicated by a horizontal black line. The horizontal dashed lines indicate a displacement of one SD from the average R2/R1 value. (B) The R2/R1 values measured for the apo enzyme are plotted on the crystal structure of Alkbh5. The relationship between experimental values and the color and size of the spheres is provided by the color bar. (C) The 15N-Rex values measured for apo Alkbh5 (top), Alkbh5-αKG (middle), and Alkbh5-αKG/m6A (bottom) are plotted versus the residue index. The localization of fragments 190 to 210 and 268 to 282 from the jelly-roll motif is shown by transparent light blue boxes. The localization of flips 1, 2, and 3 is shown by transparent gray boxes. The Rex values measured for (D) apo Alkbh5, (E) Alkbh5-αKG, and (F) Alkbh5-αKG/m6A are plotted on the crystal structure of the enzyme. The relationship between experimental values and the color and size of the spheres is provided by the color bar. The ribbon of fragments 190 to 210 and 268 to 282 is shown in cyan. Mn2+ and αKG are shown as green spheres and cyan sticks, respectively. The modeled 5′-GG(m6A)CT-3′ DNA is shown as orange, blue, and green cartoon. Fragment 145 to 149 from flip 2 (which is missing in the x-ray structure) is modeled as described in Materials and Methods. Quantitative analysis of the relaxation dispersion data is reported in figs. S4 and S5.
