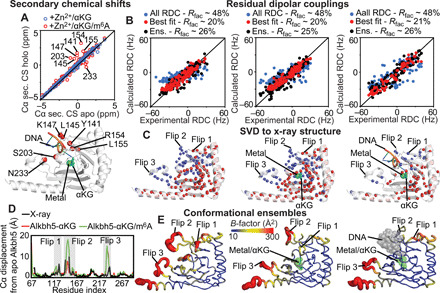
Fig. 6. Solution structure of apo and holo Alkbh5.

(A) The secondary Cα chemical shifts (CS) measured for Alkbh5-αKG (blue circles) and Alkbh5-αKG/m6A (red circles) are plotted versus the Cα secondary chemical shifts measured for apo Alkbh5 (top). Cα atoms that show a significant change in secondary chemical shift upon addition of m6A are plotted as red spheres on Alkbh5 (bottom). (B) The RDCs back-calculated from the Alkbh5 structure are plotted versus the experimental data. SVD fitting of the full set of RDCs against the x-ray structure is shown as blue circles. SVD fitting performed discarding all data from the active site is shown as red circles. RDCs back-calculated from the conformational ensemble are shown as black circles. Data are shown for apo Alkbh5 (left), Alkbh5-αKG (middle), and Alkbh5-αKG/m6A (right). (C) Structures of Alkbh5 (left), Alkbh5-αKG (middle), and Alkbh5-αKG/m6A (right) showing the amide groups whose experimental RDCs are in good agreement with back-calculated values from the x-ray structure (red spheres). Blue spheres indicate the RDCs removed from the SVD analysis. The lower number of analyzed RDCs for Alkbh5-αKG/m6A reflects the lower quality of the NMR spectrum measured in the presence of methylated oligonucleotide (fig. S3). (D) The average structures of the conformational ensembles are used to calculate the Cα displacement of Alkbh5-αKG (red line) and Alkbh5-αKG/m6A (green line) from the structure of the apo Alkbh5. The Cα displacement of the apo Alkbh5 average structure from the x-ray structure is shown as black line. (E) Conformational ensembles generated for apo Alkbh5 (left), Alkbh5-αKG (middle), and Alkbh5-αKG/m6A (right). Cartoons are colored according to the B-factor.
