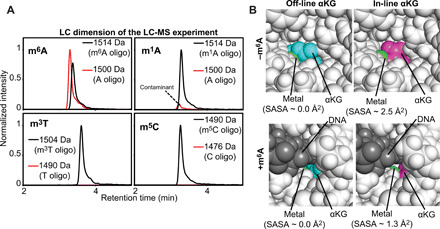
Fig. 7. The off-line to in-line transition activates Alkbh5.

(A) Demethylation activity of Alkbh5 against 5′-GG(m6A)CT-3′ (top left), 5′-GG(m1A)CT-3′ (top right), 5′-GG(m3T)CT-3′ (bottom left), and 5′-GG(m5C)CT-3′ (bottom right). Each panel shows the liquid chromatography (LC) dimension of an LC–mass spectroscopy (MS) experiment run after 60-min incubation of 10 μM substrate with 5 μM Alkbh5, 300 μM αKG, and 150 μM Fe2+ at 25°C (see Materials and Methods for further details). The red and black lines correspond to the elution profiles of the species with molecular masses corresponding to the demethylated and methylated oligonucleotides, respectively. The minor peak at 1500 Da present in the LC-MS data acquired for the 5′-GG(m1A)CT-3′ does not grow with time (i.e., it is present with the same intensity even before addition of Alkbh5 to the reaction mixture) and it was ascribed to the presence of a small contamination of nonmethylated oligonucleotide in the starting sample. (B) Solvent accessibility of the metal cofactor. Close-up view of the active site in (top left) the crystal structure of Alkbh5 bound to off-line αKG, (top right) the modeled structure of Alkbh5 bound to in-line αKG, (bottom left) the modeled structure of Alkbh5 bound to off-line αKG and 5′-GG(m6A)CT-3′, and (bottom right) the modeled structure of Alkbh5 bound to in-line αKG and 5′-GG(m6A)CT-3′. The protein is shown as white spheres. The metal is shown as a green sphere. Off-line and in-line αKG are shown as cyan and purple spheres, respectively. The 5-mer DNA is shown as gray spheres. The SASA of the metal center was calculated using the PyMOL command get_area with dot_solvent = 1 and dot_density = 3. Structural models were generated and equilibrated as described in Materials and Methods.
