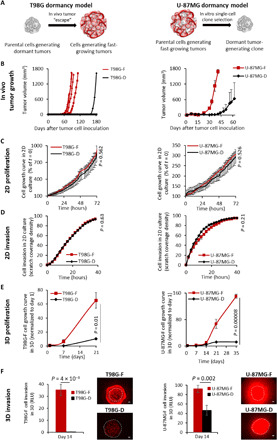
Fig. 4. Fibrin 3D-bioink reproduced the dormancy phenomenon of two GB human cell types, which thus far could only be observed in SCID mice and not in 2D culture.

(A) Schematic illustration of T98-G and U-87MG human dormancy models. (B) In vivo growth kinetics of dormant (T98G-D and U-87MG-D) and fast-growing (T98G-F and U-87MG-F) cell types. n = 4 in the T98G-F group and n = 3 in the T98G-D group. Values for U-87MG growth in mice were averaged from data previously presented (29). (C) Cell growth evaluation of both GB pairs in 2D culture. n = 3 per group. (D) Cell invasion evaluation of both GB pairs in 2D culture. n = 3 per group. (E) Growth kinetics of both dormant and fast-growing cell types were evaluated in fibrin 3D-bioink. n = 4 per group. (F) Cell invasion ability in fibrin 3D-bioink was quantified using ImageJ. n = 12 per group. Representative fluorescent images of the invasion from the core tumor model to the surrounding area are presented. Scale bars, 100 μm. Dashed lines delineate the edge between the core and the surrounding tissue according to the images on day 1.
