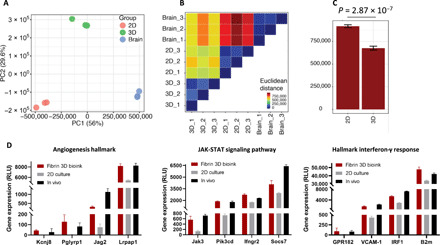
Fig. 6. RNA-seq analysis shows higher similarities between the gene expression of GL261 grown in fibrin 3D-bioink and GL261 cells grown in mice compared to those grown in 2D culture.

(A) PCA analysis showing gene expression profile derived from 2D culture, 3D-bioink, and GB tumors in mice in vivo (n = 3 per group). (B) Euclidian distance matrix between samples showing a closer distance between the in vivo samples and the fibrin 3D-bioink compared to increased distance between the in vivo samples and the 2D culture. (C) Summary comparison between the Euclidian distance of the 3D-bioink and the 2D culture to the in vivo samples (P = 2.8 × 10⁷, t test). (D) A comparison of gene expression levels of enriched pathways, displaying similarly high levels of expression both in fibrin 3D-bioink and in vivo.
