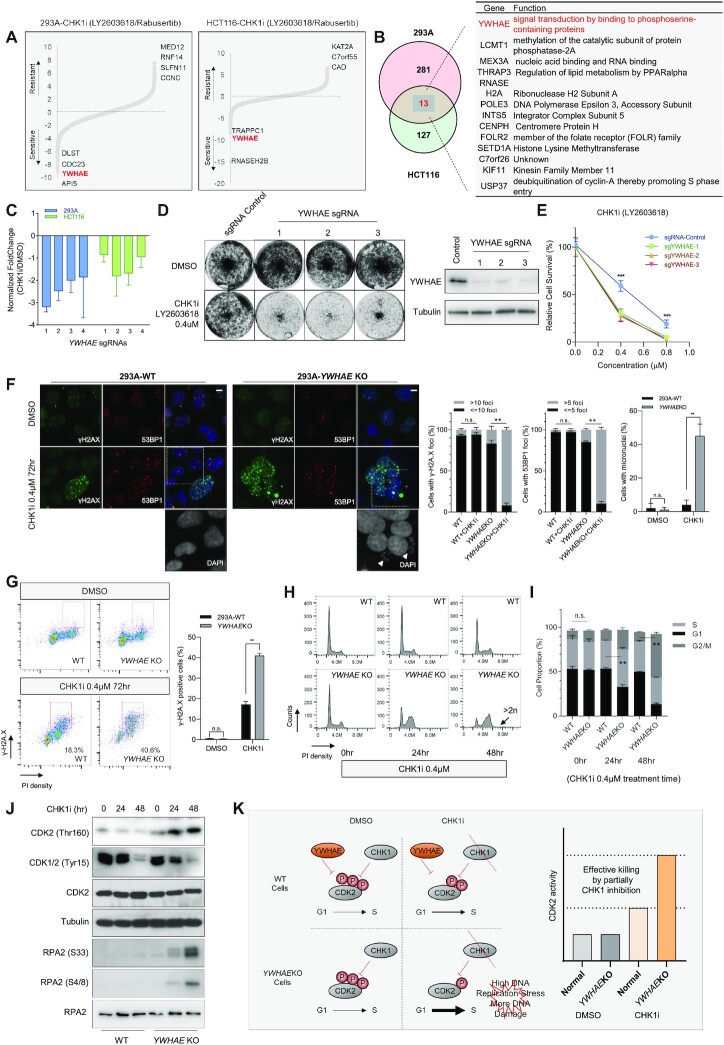
Figure 2.
Loss of YWHAE Leads to Sensitivity to CHK1i. (A) Ranking of co-essential genes with CHK1i based on DrugZ analysis of CRISPR/Cas9-based screening results conducted in 293A and HCT116 cells. The NormZ score was used to define a possible synthetic lethal interaction with CHK1i. All genes targeted by the Toronto Knock Out Library (version 3) were scored according to the fold change of levels of their sgRNAs presented in these samples (CHK1i treatment vs. DMSO treatment). Genes whose loss of function led to sensitivity to CHK1i appear on the left side, and genes whose loss of function led to resistance to CHK1i appear on the right side. Some high-confidence genes are marked. (B) Venn diagram and list showing the overlapping CHK1i co-essential genes identified in these two cell lines. (C) Normalized fold changes of sgRNAs targeting YWHAE in the CHK1i group versus DMSO control group from the screens conducted in HEK293A and HCT116 cells. The fold change comes from the sgRNA counts in the CHK1i-treated group divided by the sgRNA counts in the DMSO group in the indicated cell lines. (D) Representative crystal violet cell viability assays with HEK293A cells under CHK1i treatment. HEK293A cells transfected with control sgRNA or sgRNAs targeting YWHAE were exposed to the indicated concentration of CHK1i inhibitors and grew for 7 days (1500 cells per well in 12-well plates). The efficacy of each sgRNA was validated by Western blotting. (E) Clonogenic survival assays at different CHK1i concentrations. The mean and s.d. of n = 3 independent experiments are shown, ***P < 0.001; Student's t-test. (F) Wild type (WT) and YWHAE-knockout (KO) HEK293A cells were treated with DMSO or CHK1i (0.4 μM, 72 h). Cells were fixed and processed for γ-H2A.X and 53BP1 immunofluorescence staining. The scale bar represents 1 μm. The nuclei were enlarged to highlight the accumulated micronuclei in CHK1i-treated YWHAE-KO cells. 100 cells/group were counted. The quantification of γ-H2A.X foci, 53BP1 foci, and micronuclei in different groups are graphed on the right. The mean and s.d. of n = 3 independent experiments are shown; n.s., not significant; **P < 0.01; Student's t-test. (G) WT and YWHAE-KO HEK293A cells were treated with DMSO or CHK1i (0.4 μM, 72 h). Cells were fixed and processed for γ-H2A.X and propidium iodide staining. Fluorescence-activated cell sorting analyses were then conducted. The red rectangle indicates the γ-H2A.X-positive cells. For γ-H2A.X staining, 30 cells/group were counted. Quantification of γ-H2A.X-positive cells in each group is shown on the right. The mean and s.d. of n = 3 independent experiments are shown; n.s., not significant; **P < 0.01; Student t-test. (H) WT and YWHAE-KO HEK293A cells were treated with DMSO or CHK1i. The cells were then collected at different time points, fixed with ethanol, and stained with propidium iodide. FACS analyses were then conducted. (I) Quantification of cell populations in different cell cycle phases in WT and YWHAE-KO cells. The indicated cell populations were compared between the WT group and the YWHAE-KO group under CHK1i treatment. The mean and s.d. of n = 3 independent experiments are shown, **P < 0.01; Student's t-test. (J) The same cells in (I) were collected. Total cell lysates were blotted with the indicated antibodies. (K) A proposed model of hypersensitivity to CHK1i in YWHAE-KO cells.

