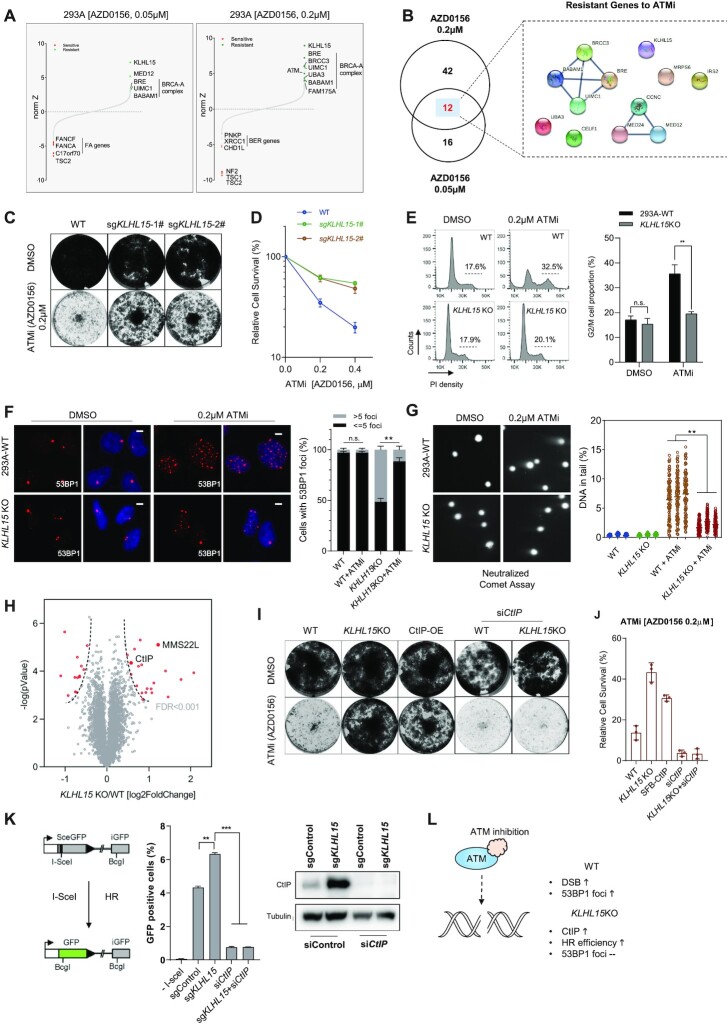
Figure 3.
KLHL15 loss protects cells from ATMi-induced DNA damage. (A) Ranking of ATMi co-essential genes after DrugZ analysis based on the results of CRISPR/Cas9-based screening using two different concentrations of ATMi. The NormZ score was used to define a possible synthetic lethal interaction with ATM inhibition. Genes whose loss of function led to ATMi sensitivity appear on the left side, and genes whose loss of function led to ATMi resistance appear on the right side. Some high-confidence genes are marked (red for synthetic lethal genes, green for resistant genes). (B) Venn diagram showing the overlapping of identified genes responsible for resistance to ATMi. The genes that overlapped in two different ATMi concentrations are listed and the gene–gene network was drawn according to STRING. (C) Loss of KLHL15 made cells resistant to ATMi treatment based on crystal violet cell viability assays. HEK293A cells transfected with control sgRNA or sgRNAs targeting KLHL15 were exposed to the indicated concentrations of ATMi and grew for 7 days (1500 cells per well in 12-well plates). (D) Clonogenic survival assays at the indicated concentrations of ATMi. The mean and s.d. of n = 3 technical replicates are shown. (E) Wild type (WT) and KLHL15-knockout (KO) HEK293A cells were treated with DMSO or ATMi. Cells were then collected after 3 days, fixed with ethanol, and stained with propidium iodide. Fluorescence-activated cell sorting analyses were then conducted. The indicated G2/M cell populations in each group were compared. The mean and s.d. of n = 3 independent experiments are shown; n.s. = not significant; **P < 0.01; Student's t-test. (F) WT and KLHL15-KO HEK293A cells were treated with DMSO or ATMi (AZD0156, 0.2 μM, 72 h). Cells were fixed and processed for 53BP1 immunofluorescence staining. The scale bar represents 1 μm. 100 cells/group were counted. Quantification of 53BP1 foci in the indicated groups is shown on the right. The mean and s.d. of n = 3 independent experiments are shown; **P < 0.01; n.s. = not significant; Student's t-test. (G) Representative images from a neutralized comet assay. WT and KLHL15-KO HEK293A cells were exposed to ATMi (AZD0156, 0.2 μM) for 24 h. The comet-tail moments from 100 cells in each condition were measured and are shown in the scatter plot. The mean and s.d. of n = 3 independent experiments are shown; **P < 0.01; Student's t-test. (H) Volcano plot shows the significant change in differentially expressed proteins in KLHL15 KO versus WT cells. Each dot represents a protein. The red dots indicate significantly upregulated and downregulated proteins, respectively (FDR < 0.001). y axis is the –log P-value, and x axis is the log2 fold change. Two known DDR related proteins are labeled with gene names. (I) Crystal violet viability assays of the indicated cells. HEK293A cells were transfected with the indicated constructs or siRNA and then exposed to the indicated ATMi (AZD0156) treatment for 7 days (1500 cells per well in 12-well plates). Abbreviations: OE, overexpressing. (J) Results of clonogenic survival assays at the indicated concentrations of ATMi (AZD0156). The mean and s.d. of n = 3 technical replicates are shown. (K) Loss of KLHL15 resulted in increased HR-directed DNA repair. U2OS-DR-GFP cells were infected with lentivirus-encoding control sgRNA or sgRNA targeting KLHL15 together with/without CtIP siRNA. The cells were then transfected with I-SceI; 48 h after transfection, cells were harvested and assayed for GFP expression using FACS. Representative data from one experiment are shown. The GFP-positive cells were gated. Quantification of these experiments is shown on the right side of the panel. The mean and s.d. of n = 3 independent experiments are shown; **P < 0.01; Student's t-test. The expression levels of CtIP were detected by Western blotting. (L) Proposed model of KLHL15 depletion leading to CtIP upregulation and resistance to ATMi.

