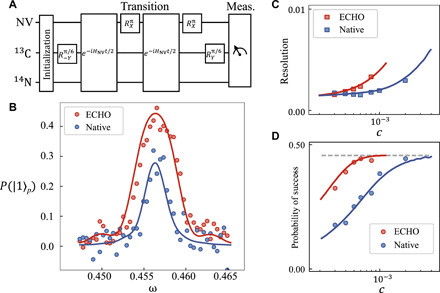
Fig. 3. RqPCA with ECHO pulses to suppress the decoherence of the probe qubit.

(A) Schematic diagram of the ECHO pulses used to suppress the decoherence effect (see Materials and Methods for details). (B) The resonant spectra with ECHO (red) and the native method (blue) when c = 6 × 10⁻⁴. (C and D) The resolution of the eigenvalue and the probability of success with respect to driving strength c. The probability of success has an upper bound (dashed horizontal line) that equals to the population of the first principal component in ρ. Here, dots are the experimental results, and solid lines are theoretically simulated results with modeled decoherence.
