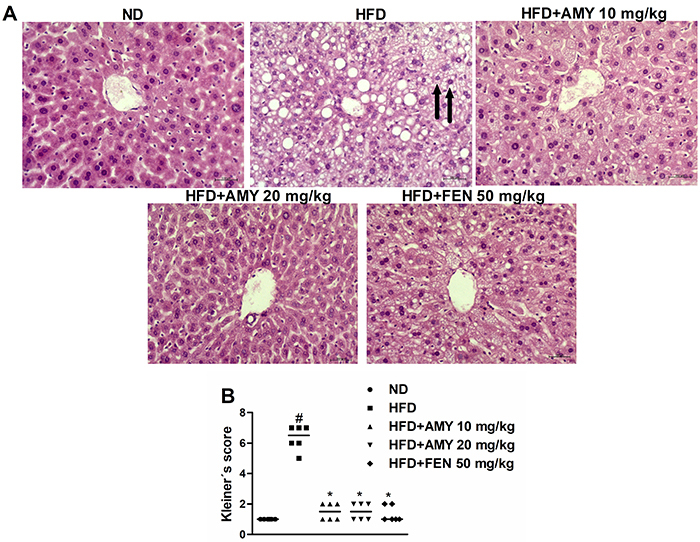
Figure 3. A, Representative liver sections (H&E stained) from ND-fed group, HFD-fed group, HFD+AMY (10 mg/kg), HFD + AMY (20 mg/kg), and HFD + FEN (50 mg/kg) (magnification: 200×, scale bar: 100 μm). Arrows indicate hepatocyte ballooning. B, The Kleiner's score of steatosis, lobular inflammation, and hepatocyte ballooning. Data are reported as median values (n=6). #P<0.05 vs ND-fed animals; *P<0.05 vs HFD-fed animals (Kruskal-Wallis followed by Dunn's test). ND: normal diet; HFD: high-fat diet; AMY: α,β-amyrin; FEN: fenofibrate.

