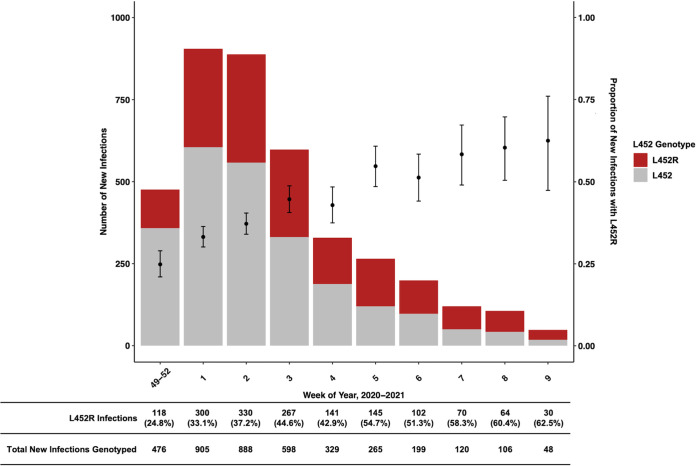
FIG 5.
Local epidemiologic emergence of L452R mutations in our genotyped population of 3,934 unique infections from December 2020 to March 2021. The bar plot and left y axis represent numbers of new unique genotyped infections by week grouped by RT-qPCR-defined genotype. The scatterplot and right y axis represent proportions of new unique genotyped infections with the L452R genotype, with the 95% Clopper-Pearson confidence interval. Rows under the main figure correspond to numbers and percentages of infections with the L452R genotype among all genotyped strains during each time interval. Infections are grouped by the week in which the initial diagnostic SARS-CoV-2 nucleic acid amplification test was positive. Weeks 48 to 52 are grouped due to fewer tested specimens in December of 2020.

