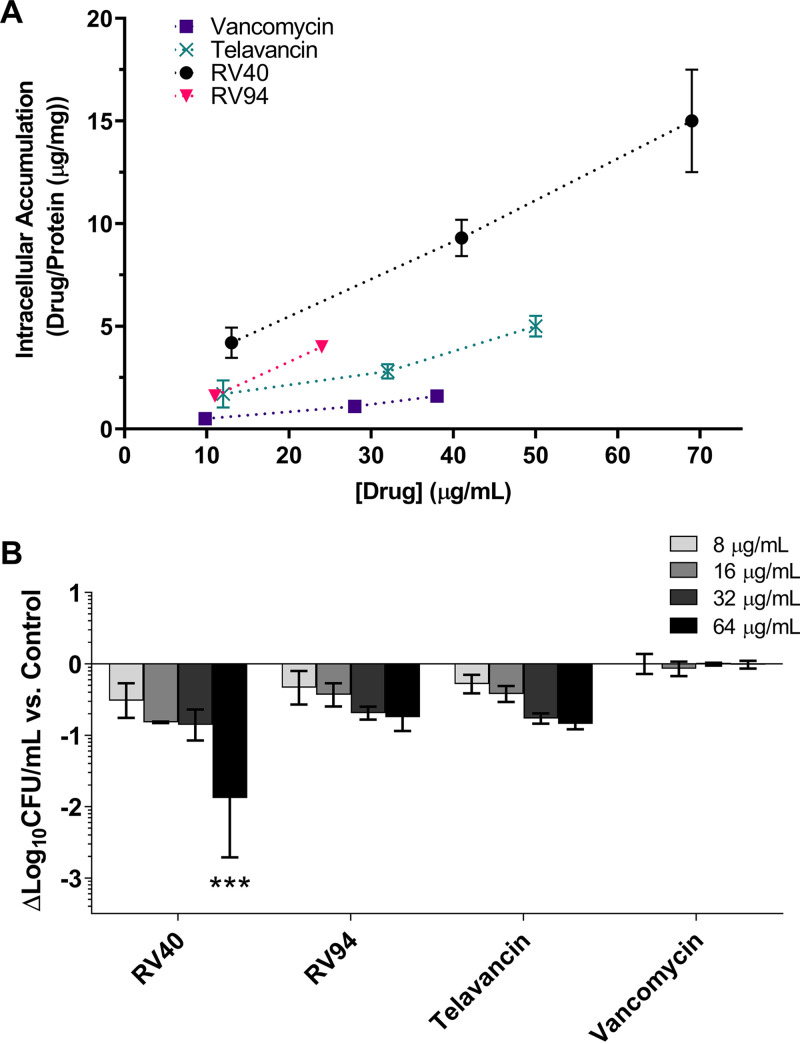
FIG 3.
In vitro accumulation and MRSA killing of RV94 and comparators in THP-1 cells. (A) Cellular accumulation of RV compounds and comparators in THP-1 cells. Cells were treated with test compounds for 24 h. Data are plotted as means ± standard deviation (SD) (n = 3 per time point). (B) In vitro intracellular activity of RV compounds against intracellular MRSA ATCC BAA 1556 (USA300) in THP-1 cells. Cells were infected with MRSA for 1 h at MOI equal to 10. Incubation with lysostaphin (25 mg/ml) was done for 2 h to eliminate residual extracellular bacteria. Wells were washed with PBS, replaced with medium containing test compounds and 150 nM bafilomycin A1 (47), and incubated for 24 h. After treatment, cells were lysed and surviving intracellular bacteria were enumerated. Log10 CFU reduction for each concentration of respective test compound relative to the log10 CFU count of untreated cells is presented. The average untreated cell MRSA count was 4.9 ± 0.5 log10 CFU/ml (n = 3). Each ml of medium contained 7.5 × 10⁵ cells. Data are plotted as averages ± SD; n = 3 (RV40, telavancin, and vancomycin) or n = 2 (RV94) per experiment, with each experiment having n = 3 measurements. Limit of detection (LOD) = 2.0 log10 CFU/ml. Statistics are based on two-way ANOVA with Bonferroni's multiple-comparison test. P = 0.0005 for RV40 (64 μg/ml) versus control.

