FIG 6.
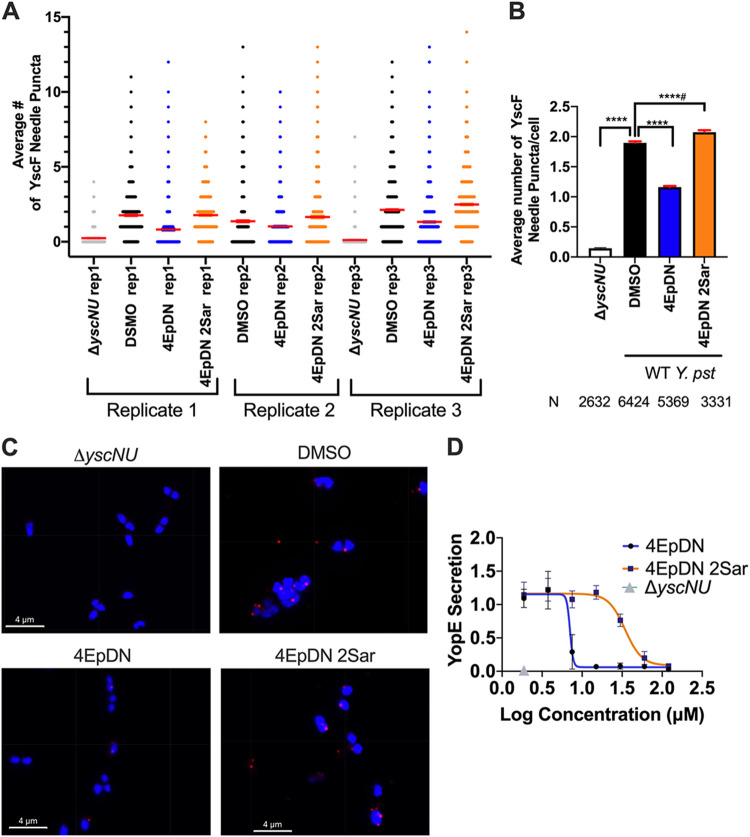
YscF puncta visualization using immunofluorescence. Y. pseudotuberculosis was grown under T3SS-inducing conditions (low Ca2+) in the presence of 60 μM cyclic peptomers or an equivalent volume of DMSO. A mutant lacking yscN and yscU was used as a negative control. (A) Scatterplot of YscF puncta/cell for the three replicates. Means ± the standard error of the mean (SEM) are shown in red. The width of distribution of points is proportional to the number of data points at the Y value. (B) Mean number of puncta/cell after treatment for all replicates combined ± SEM. (C) Representative images of YscF puncta in different conditions. (Imaris software displays grid lines within the images; they are not physical lines on the samples.) (D) Secretion of effector YopE in low-calcium medium on the presence of different concentrations of 4EpDN and 4EpDN 2Sar in WT Y. pseudotuberculosis stained with Coomassie stain and quantified. The data represent three independent experiments. The nonparametric Kruskal-Wallis test with Dunn’s multiple-comparison test was used. ****, P < 0.0001; ****, P < 0.0001, but the trend is in the reversed direction.

