
FIGURE 5.
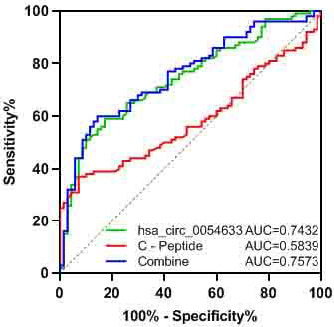
ROC analysis of expression of Hsa_circ_0054633 and serum C peptide level. The ROC curve analysis was conducted, and the area under ROC curve was 0.7432, 0.5839, and 0.7573 for Hsa_circ_0054633, C peptide, and their combination. AUC mean area under the curve