
FIGURE 1.
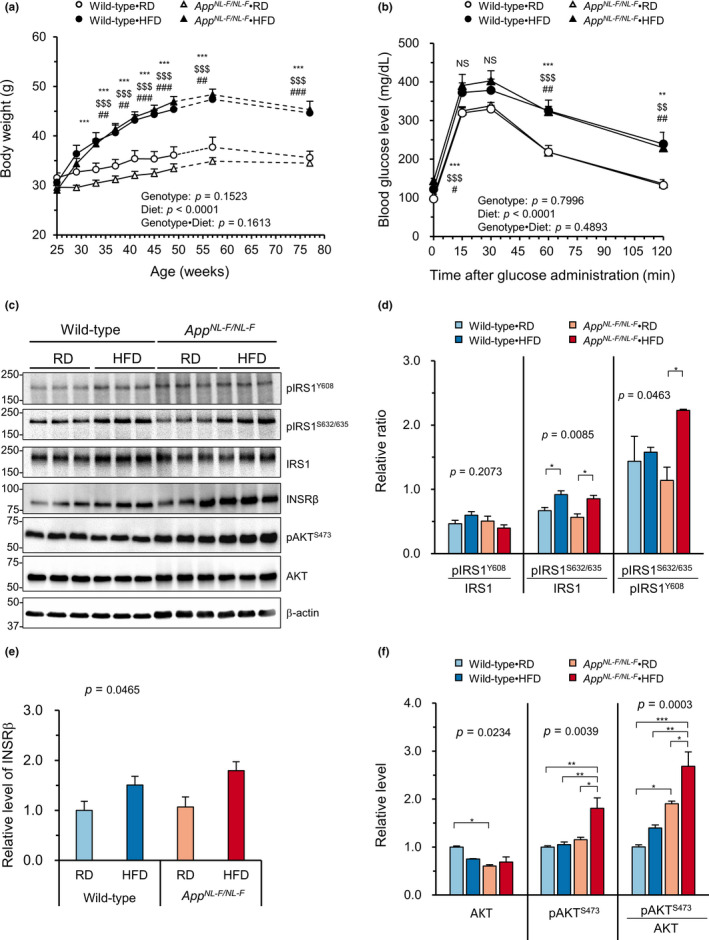
A high‐fat diet led to increased body weight, impaired glucose metabolism, and an impaired insulin signaling pathway in both wild‐type and AppNL−F/NL−F mice. (a) Six‐month‐old wild‐type and AppNL−F/NL−F mice were fed either a regular (RD) or high‐fat diet (HFD), and their weights were plotted every 4 weeks for a period of 24 weeks (solid line) and then at 58 and 78 weeks of age (dotted line). (b) Intraperitoneal glucose tolerance test at 18 months of age. After 6 h of fasting, mice were injected with glucose (2 g/kg of body weight). Blood glucose levels were then monitored over time. (c) Representative Western blots showing the hippocampal levels of insulin signaling proteins (pIRS1Y608, pIRS1S632/635, IRS1, INSRβ, pAKTS473, and AKT) in AppNL−F/NL−F and wild‐type mice fed an RD or HFD. (d) Relative ratios of pIRS1Y608/IRS1, pIRS1S632/635/IRS1, and pIRS1S632/635/pIRS1Y608 in the blots using β‐actin as a loading control. (e) Quantification of protein levels of INSRβ in the blot using β‐actin as a loading control. (f) Quantification of the protein levels of pAKTS473 and AKT and the pAKTS473/AKT ratio in the blots using β‐actin as a loading control. The bar graph shows the protein/β‐actin ratio relative to RD‐fed wild‐type mice. The data were expressed as the mean ± SEM, n = 17 (solid line) or 10 (dotted line) for RD‐fed wild‐type mice (Wild‐type•RD), n = 12 (solid line) or 5 (dotted line) for HFD‐fed wild‐type mice (Wild‐type•HFD), n = 29 (solid line) or 13 (dotted line) for RD‐fed AppNL−F/NL−F mice (AppNL−F/NL−F •RD), and n = 22 (solid line) or 12 (dotted line) for HFD‐fed AppNL−F/NL−F mice (AppNL−F/NL−F •HFD) in (a); n = 4–5 for all groups in (b). n = 3 for all groups in (d–f). The results were statistically analyzed by a MANOVA (p values for effects are shown) with data from 25 to 49 weeks of age in (a) or 0 to 120 min in (b), and a two‐way ANOVA followed by post hoc Tukey's Honest Significant Difference (HSD) test was applied to the data for each week, ** p < 0.01 and *** p < 0.001 for AppNL−F/NL−F •HFD vs. AppNL−F/NL−F •RD; $$ p < 0.01 and $$$ p < 0.001 for AppNL−F/NL−F •HFD vs. Wild‐type•RD; and # p < 0.05, ## p < 0.01, ### p < 0.001 for Wild‐type•HFD vs. Wild‐type•RD. NS, not significant. Weeks 58 and 78 in (a) were excluded from the two‐way repeated measures ANOVA and instead subjected to a one‐way ANOVA with post hoc Tukey's HSD test. The results in (d–f) were statistically analyzed by a two‐way ANOVA (p values for each analysis shown) followed by post hoc Tukey's HSD test, * p < 0.05, ** p < 0.01 and *** p < 0.001