
FIGURE 2.
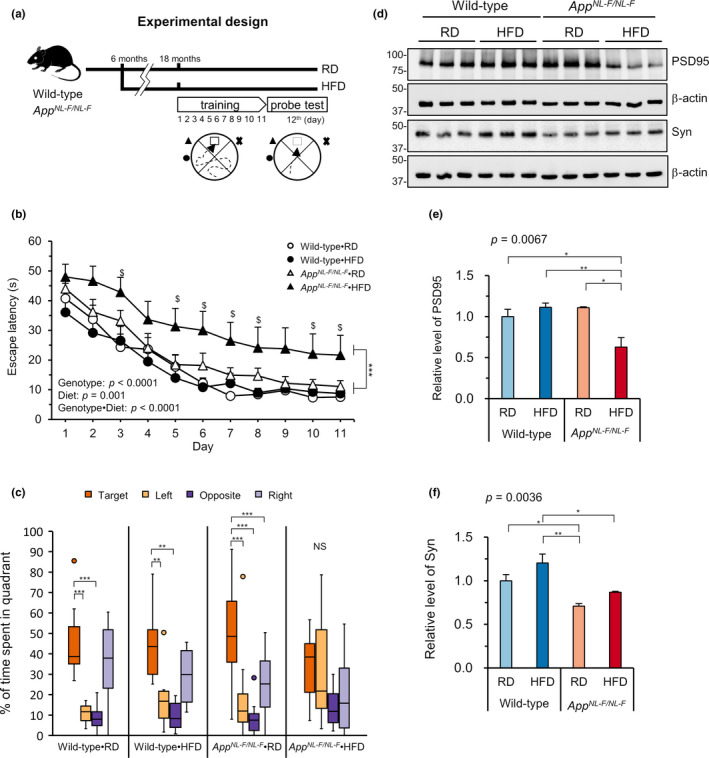
High‐fat diet treatment impaired spatial learning and levels of post‐synaptic markers in AppNL−F/NL−F mice. (a) Diagram of the experimental design for the behavioral test. Six‐month‐old wild‐type and AppNL−F/NL−F mice were fed either a regular diet (RD) or high‐fat diet (HFD). When they reached 18 months of age, spatial learning and memory recall were tested by a Morris Water Maze test (MWM). (b) The MWM test showed a significantly impaired spatial learning ability in the AppNL−F/NL−F mice fed an HFD (AppNL−F/NL−F •HFD) compared with all three other groups. (c) Percentage of the time spent in each quadrant during the probe test, 24 h after the last training. AppNL−F/NL−F •HFD mice, but not other three groups of mice, showed no preference for the target quadrant among the four quadrants. (d) Western blots showing the hippocampal levels of PSD95 and synaptophysin (Syn) in AppNL−F/NL−F and wild‐type mice fed an RD or HFD. (e–f) Quantification of protein levels in blots using β‐actin as a loading control. The bar graph shows the protein/β‐actin ratio relative to RD‐fed wild‐type mice. Data are expressed as the mean ± SEM, n = 11–14 for all groups for (b–c) and n = 3 for (e–f). Statistical analyses for (b) were performed by a two‐way repeated measures ANOVA (p values for effects are shown) where *** p < 0.001 for AppNL−F/NL−F •HFD vs. all three other groups, followed by post hoc Tukey's HSD test, where $ p < 0.05 for AppNL−F/NL−F •HFD vs. Wild‐type•RD. A nonparametric comparison with the % time spent in the target quadrant performed using the Steel method (c), where *** p < 0.001. For (e, f), a two‐way ANOVA (p values for each analysis shown) was performed followed by post hoc Tukey's HSD test, * p < 0.05, ** p < 0.01