
FIGURE 3.
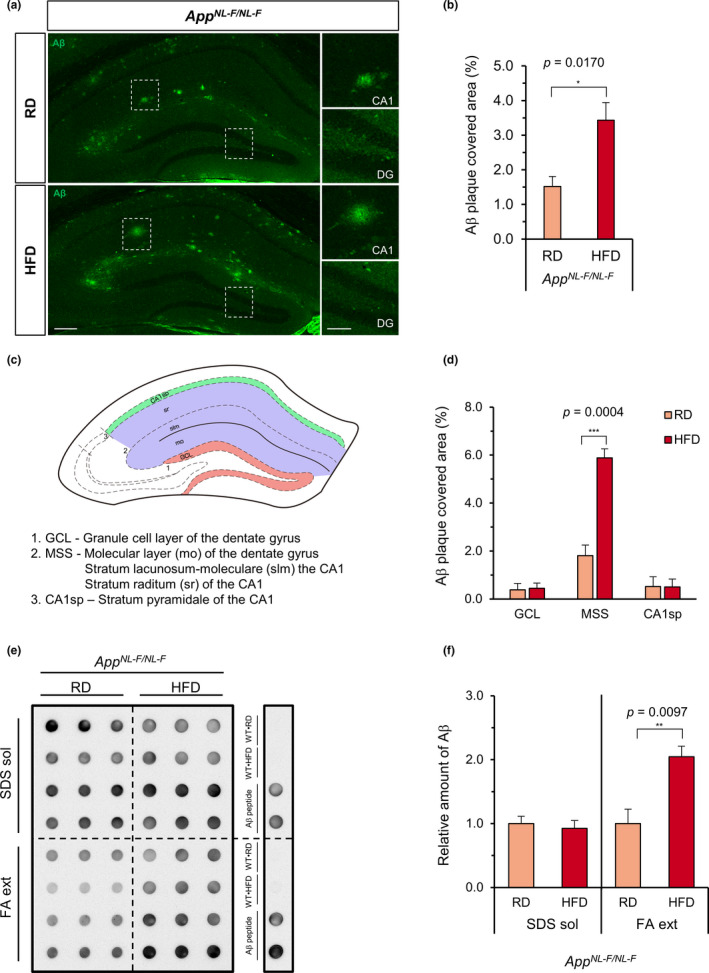
High‐fat diet treatment increased the amyloid‐β deposition in the hippocampus of AppNL−F/NL−F mice. (a) Representative immunofluorescence images of Aβ in the hippocampus of AppNL−F/NL−F mice fed a regular diet (RD) or high‐fat diet (HFD). Aβ plaques were stained using anti‐Aβ 82E1(green) and subsequentially quantified. No plaques were detected in the wild‐type mice (Figure S3). Scale bar = 200 µm (for full image) and 100 µm (for augmented areas), DG =dentate gyrus. (b) Quantification of the Aβ plaque‐covered area in the whole hippocampus. (c) Diagram depicting the 3 studied zones in the hippocampus; granule cell layer of DG (GCL), the molecular layer of DG plus the stratum lacunosum moleculare—stratum radiatum of CA1 (MSS), and the stratum pyramidale of CA1 (CA1sp) are shown. (d) Quantification of the Aβ plaque‐covered area in 3 different zones of the hippocampus. The Aβ plaque‐covered area is shown as bar graphs. (e) Aβ dot blotting of the SDS‐soluble (SDS sol.) and formic acid‐extractable (FA ext.) protein fractions of hippocampal tissue of AppNL−F/NL−F mice fed an RD or HFD. Three dots in each row were from the same sample, and the blot was reacted with anti‐Aβ 82E1. Wild‐type•RD (WT•RD), Wild‐type•HFD (WT•HFD), and Aβ peptide were used as controls. No Aβ was detected in the wild‐type samples. (f) Quantification of the Aβ in the dot blot. The values are relative to the integrated density of the dot blot observed in RD‐fed AppNL−F/NL−F mice. The mean intensities were normalized to Ponceau S staining (SDS sol) or total protein (FA ext). Data expressed as the mean ± SEM, n = 4 for all experiments. Four brain slices per mouse were examined for (b) and (d). The results were statistically analyzed by an unpaired t test, * p < 0.05, ** p < 0.01, and *** p < 0.001