
FIGURE 4.
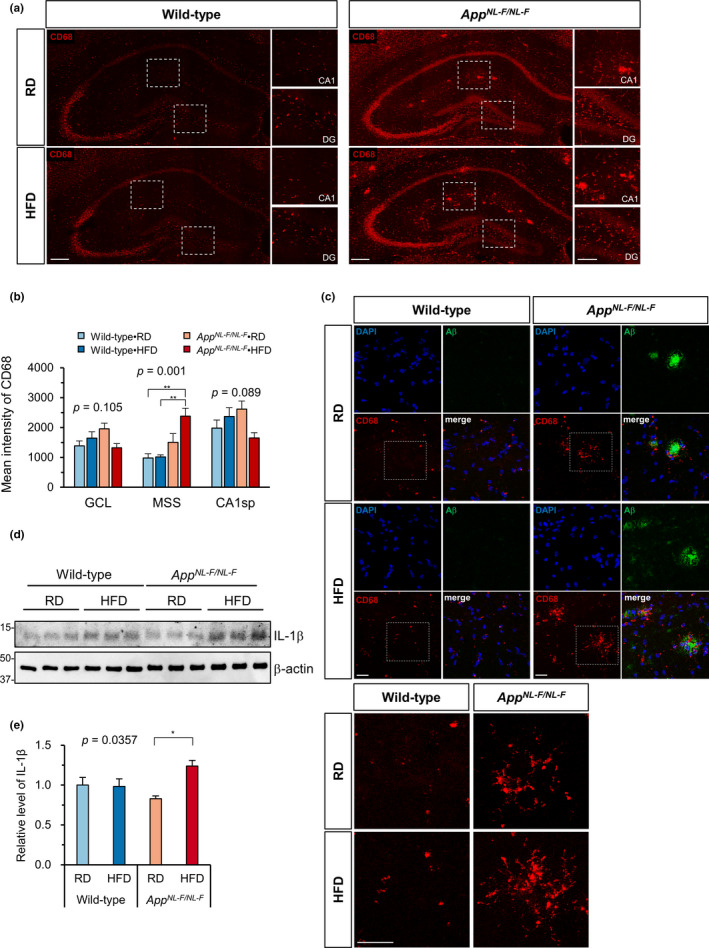
A high‐fat diet promoted microglial activation in the hippocampus of AppNL−F/NL−F mice. (a) Representative immunofluorescence images of CD68‐positive microglial cells in the hippocampus of AppNL−F/NL−F and wild‐type mice fed an RD or HFD. Scale bar = 200 µm (for full image) and 100 µm (for magnified images), DG, dentate gyrus. (b) Quantification of CD68 intensity in three different zones of the hippocampus shows the increased expression of CD68 in AppNL−F/NL−F mice fed an HFD. (c) Z‐stack projections of multi‐immunofluorescence images for Aβ and CD68 shows that CD68‐positive microglia were clustered surrounding Aβ plaques (top). Magnified view of the dotted boxes for CD68 signal (bottom). Scale bar = 50 µm. (d) Western blots showing the hippocampal levels of IL‐1β in AppNL−F/NL−F and wild‐type mice fed an RD or HFD. (e) Quantification of IL‐1β levels in blots using β‐actin as a loading control. The bar graph shows the IL‐1β/β‐actin ratio relative to RD‐fed wild‐type mice. Data are expressed as the mean ± SEM, n = 4 and four brain slices per mouse were examined for (b) and n = 3 for (e). The results were statistically analyzed by a two‐way ANOVA (p values for each analysis shown) followed by post hoc Tukey's HSD test, where * p < 0.05 and ** p < 0.01