
FIGURE 6.
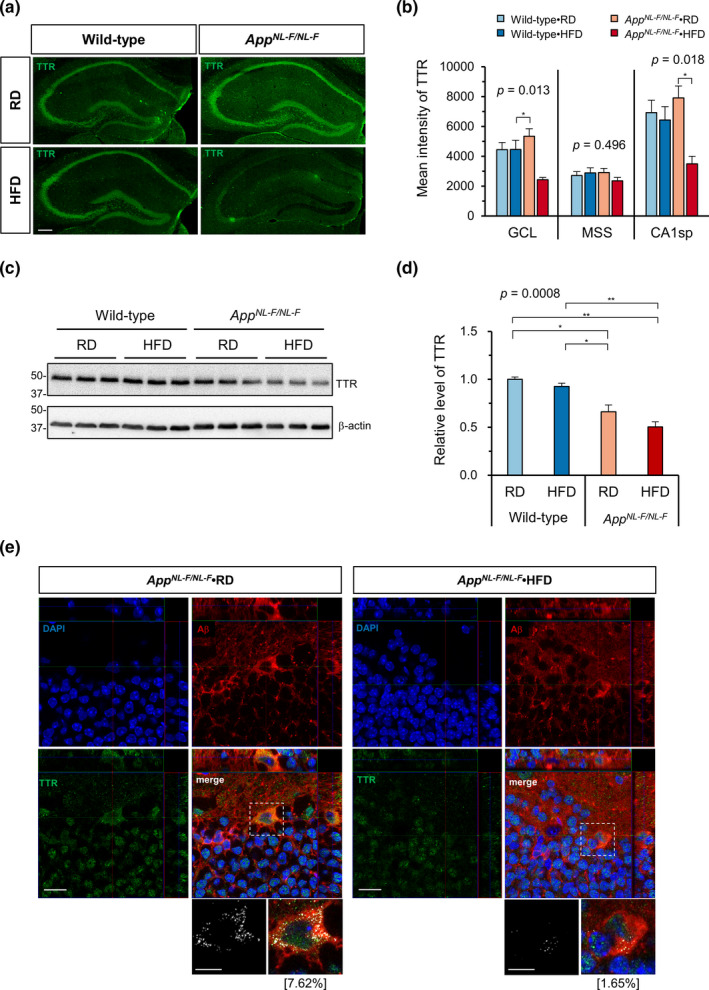
A high‐fat diet decreased the transthyretin expression in the hippocampus of AppNL−F/NL−F mice. (a) Representative immunofluorescence images of TTR in the hippocampus of AppNL−F/NL−F and wild‐type mice fed an RD or HFD. Scale bar = 200 µm. (b) The quantitative measurement of the TTR intensity in three zones of the hippocampus (GCL, MSS, and CA1sp) revealed the decreased expression of TTR in AppNL−F/NL−F mice fed an HFD. (c) Representative Western blots showing the hippocampal levels of TTR in AppNL−F/NL−F and wild‐type mice fed an RD or HFD. (d) Quantification of TTR protein levels in blots using β‐actin as a loading control. The bar graph shows the TTR/β‐actin ratio relative to RD‐fed wild‐type mice. (e) Orthogonal view of multi‐immunofluorescence microscopy for Aβ and TTR shows the intracellular TTR signal co‐localized with Aβ in AppNL−F/NL−F mice fed an RD. In magnified bitmap images from the dotted boxes (bottom), the co‐localized red and green pixels are shown in white. The percentage of the co‐localized pixels among total TTR pixels is shown in brackets. Scale bar = 20 µm for full images and 10 µm for magnified images. Data are expressed as the mean ± SEM, n = 3 for all experiments, and 3 brain slices per mouse were examined for (b). The results were statistically analyzed by a two‐way ANOVA (p values are shown for each analysis) followed by post hoc Tukey's HSD test, * p < 0.05, and ** p < 0.01