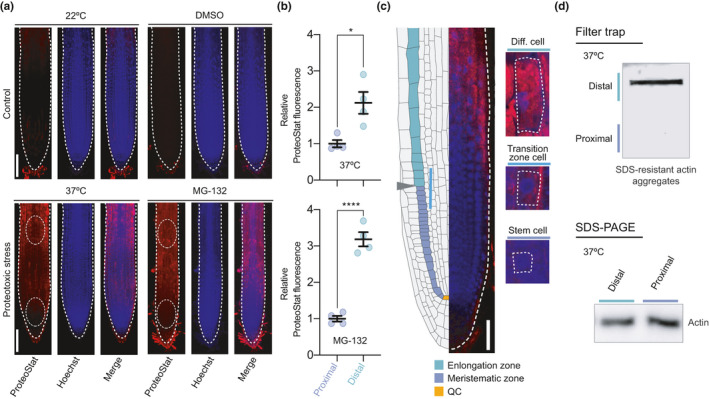
FIGURE 1.

Proteotoxic stress causes differential protein aggregation in the distinct cell types of the root. (a) Representative images of wild‐type plant roots grown under control (22°C or 22°C + DMSO) or proteotoxic stress conditions stained with ProteoStat Aggresome Detection kit. ProteoStat (red, protein aggregates), Hoechst (blue, nuclei), and Merge (ProteoStat and Hoechst) images are shown. For heat stress assay, 4 days after germination (DAG) plants were transferred to 37°C for 2 days. For proteasome inhibition experiments, plants were germinated and grown in plates supplemented with 30 µM MG‐132 and analyzed at 6 DAG stage. White bars represent 100 µm. (b) Relative ProteoStat fluorescence levels comparing the area containing proximal (close to the QC) and distal cells from roots under proteotoxic stress (areas used for quantification are indicated with white dotted ovals in Figure 1a). Scatter plots represent mean ± s.e.m of four independent experiments. The statistical comparisons were made by two‐tailed Student's t test for unpaired samples. p values: *p < 0.05, ****p < 0.0001. (c) Left side, scheme indicating the structure of the Arabidopsis root meristem. The QC is indicated in orange color, the meristematic zone in green, and the elongation zone in purple. Gray arrowhead indicates the transition zone, where cells leave the meristem and enter the elongation/differentiation zone. Right side, close examination of a representative MG‐132‐treated root showing differential protein aggregation in cortical cells dividing and differentiating in opposite direction to the QC. White bar indicates 50 µm. (d) Filter trap and SDS‐PAGE analysis with antibody to actin of the areas containing proximal and distal cells from roots under proteotoxic stress (37°C for 2 days). The images are representative of two independent experiments
