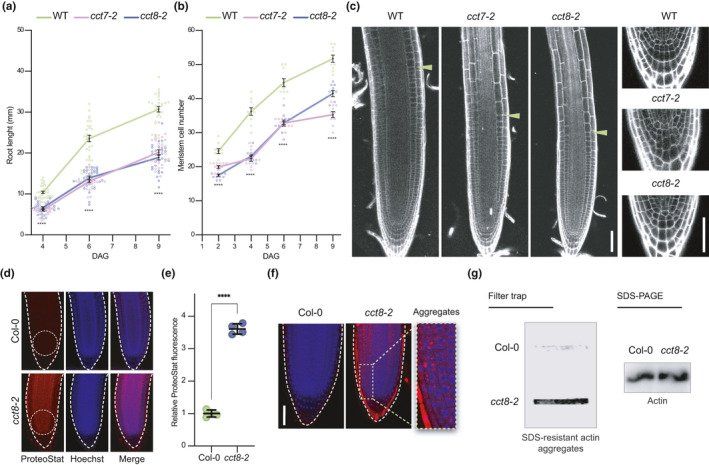
FIGURE 3.

Reduced expression of CCT triggers protein aggregation in root stem cells and impairs stem cell function. (a) Root length over time in wild‐type (WT), cct7‐2, and cct8‐2. DAG, days after germination (n = 30 roots from three independent experiments). (b) Meristem cell number over time in WT, cct7‐2, and cct8‐2 (n = 10 roots from three independent experiments). In (a–b) staggered plot showing connecting lines to the means. (c) Representative images of propidium iodide (PI)‐stained roots show differences between the meristem size of Col‐0 WT and cct roots at 4 DAG. Green arrowheads indicate the junction between the meristematic and elongation zone. Lower panels show a magnification to the QC and columella cells. Scale bars represent 50 µm. (d) Representative images of ProteoStat staining of Col‐0 WT and cct8‐2 mutant at 6 DAG. Seedlings were grown under control conditions (22°C). Scale bar represents 50 µm. (e) Relative ProteoStat fluorescence levels within the area containing proximal cells (close to the QC) of cct8‐2 relative to Col‐0 control (mean ± s.e.m of 4 independent experiments). The areas used for quantification are indicated with white dotted ovals in Figure 3d. (f) Higher magnification of the stem cell niches of Col‐0 and cct8‐2. Scale bar represents 50 µm. (g) Filter trap and SDS‐PAGE analysis with antibody to actin of Col‐0 and cct8‐2 plants. The images are representative of two independent experiments. All the statistical comparisons in (a, b and e) were made by two‐tailed Student's t test for unpaired samples. p value: ****p < 0.0001
