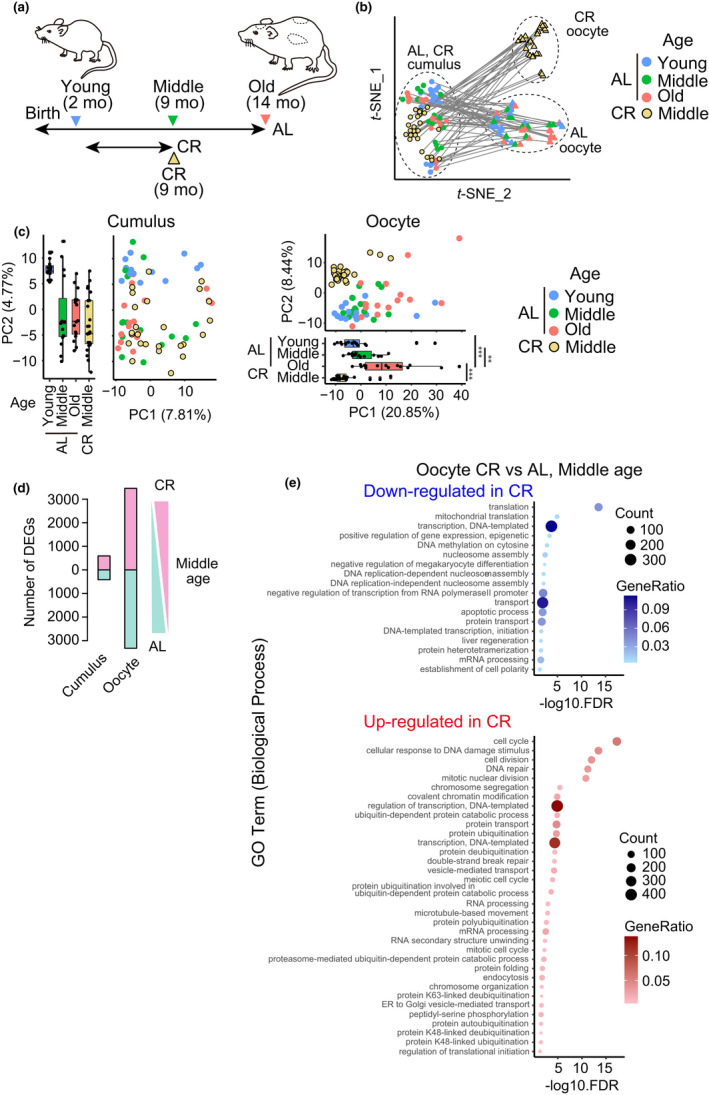
FIGURE 3.

Pronounced effects of CR on transcriptome profiles in oocytes. (a) Design overview of CR. Note that the AL datasets used in this figure are identical to those used in Figure 1. (b) t‐SNE plot showing the distribution of single oocytes and their surrounding cumulus cells. Circles and triangles represent cumulus cells and oocytes, respectively. The pairs of oocytes and their surrounding cumulus cells are connected with a line. (c) PCA plot of all expressed genes in cumulus cells (left) and in oocytes (right), respectively. **p < 0.01 and ***p < 0.001 (pairwise t test with holm correction). (d) The number of DEGs between CR and AL in oocytes at middle age. (e) Representative GO terms of down‐regulated (top) and up‐regulated (bottom) enrichment between CR and AL oocytes
