
FIGURE 6.
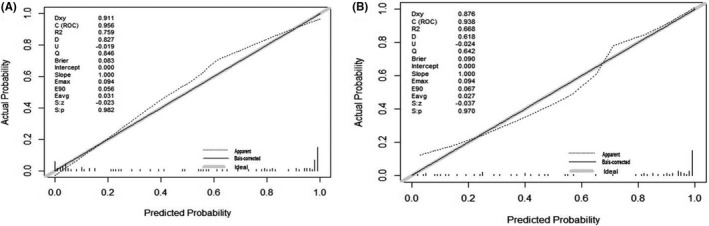
The calibration curve of the nomogram for the probability of TB. Calibration plot of the nomogram for the probability of TB in (A) TB patients and HCs and (B) TB patients and TB‐DCs. HCs, healthy controls; TB, tuberculosis; TB‐DCs, non‐TB disease controls