FIGURE 1.

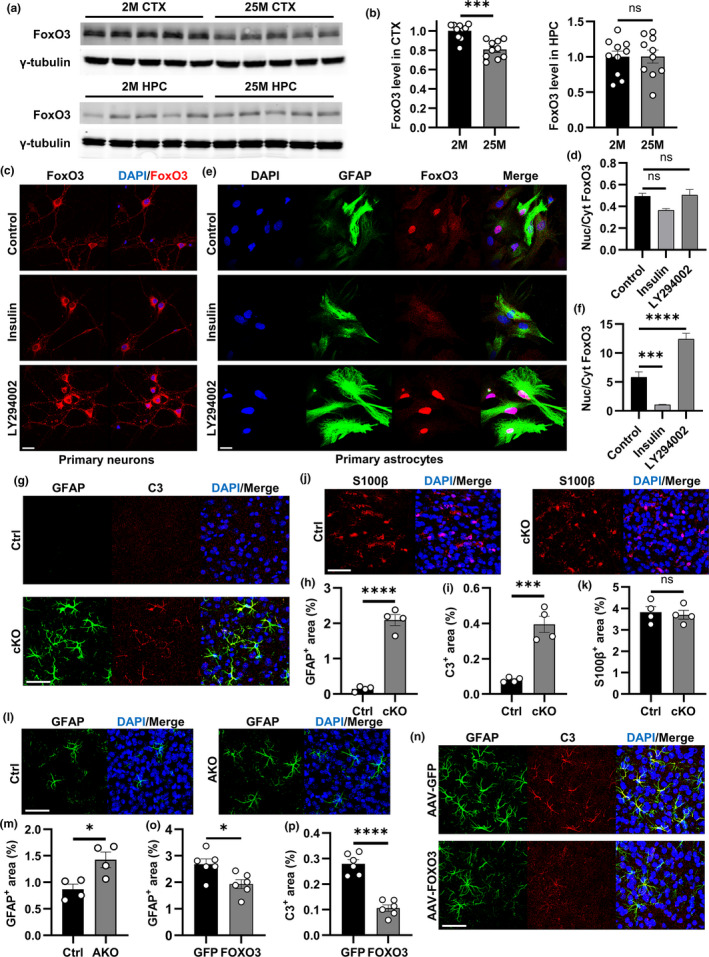
Regulation and function of FoxO3 in astrocytes. (a) Representative Western blots of FoxO3 protein levels in the cortex (upper panel) and hippocampus (lower panel) from mice at 2 months and 25 months. γ‐tubulin was used as the internal control. (b) Quantification of the levels of FoxO3 normalized to γ‐tubulin in (a). N = 10 (5 male +5 female)/group. (c) Representative confocal images showing FoxO3 subcellular localization in primary neurons via immunofluorescent staining after control (vehicle), insulin, or LY294002 treatment. Scale bar: 25 μm. (d) Quantification of nuclear/cytoplasmic FoxO3 ratio in (c). NControl=14; NInsulin = 3; NLY294002=8. (e) Representative confocal images showing FoxO3 subcellular localization in primary astrocytes via immunofluorescent staining after control (vehicle), insulin, or LY294002 treatment. GFAP was used as a marker for astrocytes. Scale bar: 25 μm. (f) Quantification of nuclear/cytoplasmic FoxO3 ratio in (e). NControl=29; NInsulin = 25; NLY294002=25. (g) Representative confocal images showing cortical astrocytes via immunofluorescent co‐staining of GFAP and C3 of cKO and Ctrl brain sections at 3 months of age. Scale bar: 50 μm. (h) Quantification of the GFAP‐positive percentage area in (g). N = 4/group. (i): Quantification of the C3‐positive percentage area in (g). N = 4/group. (j) Representative confocal images showing cortical astrocytes via immunofluorescent staining of S100β of cKO and Ctrl brain sections at 3 months of age. Scale bar: 50 μm. (k) Quantification of the S100β‐positive percentage area in (j). N = 4/group. (l) Representative confocal images showing cortical astrocytes via immunofluorescent staining of GFAP of AKO and Ctrl brain sections at 3 months of age. Scale bar: 50 μm. (m) Quantification of the GFAP‐positive percentage area in (l). N = 4/group. (n) Representative confocal images of C3 and GFAP co‐staining of cortical sections from 3‐month‐old Foxo3 cKO mice with AAV‐FOXO3 or AAV‐GFP injections. Scale bar: 50 μm. O: Quantification of the GFAP‐positive percentage area in (n). N = 6/group. (p): Quantification of the C3‐positive percentage area in (n). N = 6/group. Male mice were used in both groups in (g–p). Data are presented as mean ±SEM. Significance determined by Student's t test or one‐way ANOVA with Tukey's multiple comparisons test. ns, not significant, *p < 0.05, ***p < 0.001, ****p < 0.0001
