FIGURE 2.

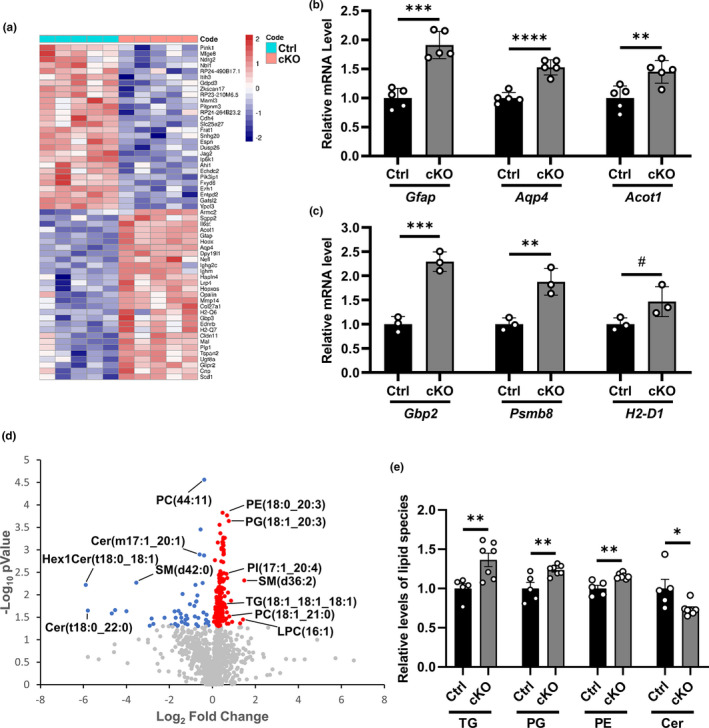
FoxO3 deletion alters the overall lipid profile in the brain. (a) Heatmap showing differentially expressed genes (DEGs) from the RNA‐seq analysis of cortex samples of Foxo3 cKO and Ctrl mice at 3 months of age. FDR<0.05. N = 5. (b) qPCR analysis of the mRNA levels of Gfap, Aqp4, and Acot1 in the cortex samples of Foxo3 cKO and Ctrl mice at 3 months of age. N = 5. (c) qPCR analysis of the mRNA levels of Gbp2, Psmb8, and H2‐D1 in the cortex samples of Foxo3 cKO and Ctrl mice at 3 months of age. N = 3. (d) Volcano plot showing the fold change and p value distribution of the identified lipid species from lipidomics analysis of cortex samples of Foxo3 cKO and Ctrl mice at 3.5 months of age. Significantly upregulated lipids (red), significantly downregulated lipids (blue), and lipids with insignificant change (gray) are labeled. NCtrl=5; NcKO=7, p < 0.05. (e) Quantification of total abundance of triglyceride (TG), phosphatidylglycerol (PG), phosphatidylethanolamine (PE), and ceramide (Cer) among the differentially regulated lipids in (d). NCtrl=5; NcKO=7. Male mice were used in both groups. Data are presented as mean ±SEM. Significance determined by Student's t test. #p < 0.1, *p < 0.05, **p < 0.01, ***p < 0.001, ****p < 0.0001
