FIGURE 3.

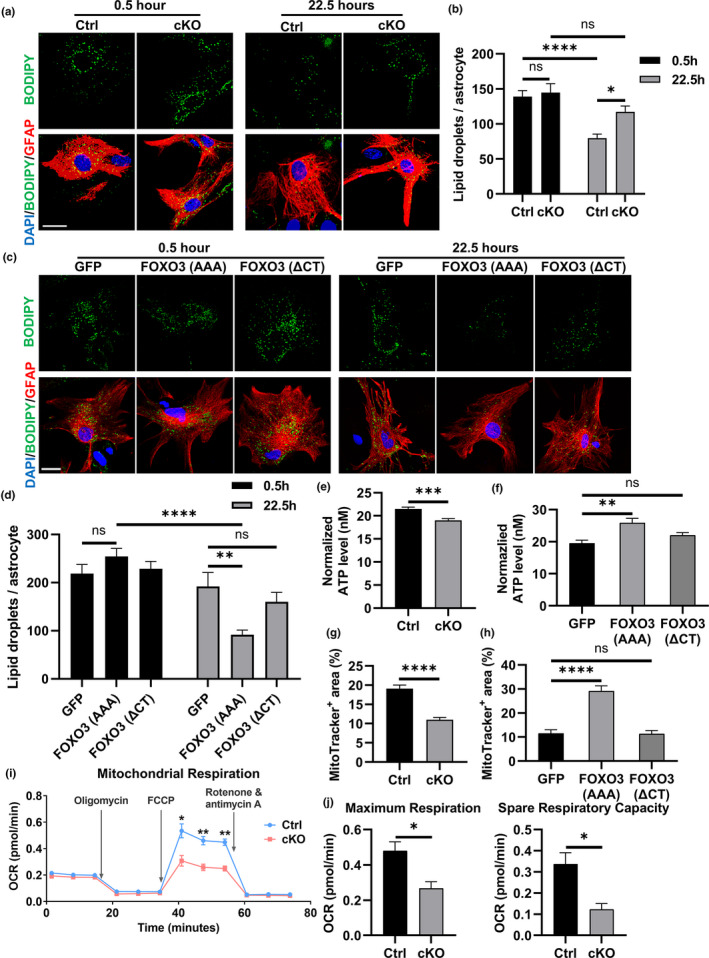
FoxO3 deficiency impairs lipid metabolism and mitochondrial function in cultured astrocytes. (a) Representative confocal fluorescent images of Foxo3 cKO and Ctrl astrocytes after 8 h of 200 μM oleate‐BSA treatment followed by incubation in fresh medium for indicated times. Fixed cells were stained with BODIPY 493/503 (green) to label lipid droplets and immunostained with GFAP antibody (red) to label astrocytes. Scale bar: 25 μm. (b) Quantification of lipid droplets number in astrocytes in (a). N = 24. (c) Representative confocal fluorescent images of Foxo3 cKO astrocytes infected with AAVs expressing GFP, FOXO3 (AAA) and FOXO3 (ΔCT) in the lipid consumption assay. Fixed cells were stained with BODIPY 558/568 (green) to label lipid droplets and immunostained with GFAP antibody (red) to label astrocytes. Scale bar: 25 μm. (d) Quantification of lipid droplets number in astrocytes in (c). N = 25. (e) ATP levels from a luciferase‐based ATP assay in Foxo3 cKO and Ctrl astrocytes. Data were normalized to the protein levels determined by the BCA assay. N = 12. (f) ATP levels from a luciferase‐based ATP assay using Foxo3 cKO astrocytes infected with AAVs expressing GFP, FOXO3 (AAA), and FOXO3 (ΔCT). Data were normalized to the protein levels determined by the BCA assay. N = 8. G: The percentage area of Mitotracker‐positive staining in Foxo3 cKO and Ctrl astrocytes. NCtrl=32; NcKO=37. (h) The percentage area of Mitotracker‐positive staining in Foxo3 cKO astrocytes infected with AAVs expressing GFP, FOXO3 (AAA), and FOXO3 (ΔCT). N = 12. (i) Representative oxygen consumption rate (OCR) curve from Seahorse mito stress test in Foxo3 cKO and Ctrl primary astrocytes. Oligomycin, FCCP and Rotenone & antimycin A were added in order to the culture medium. Results were normalized to the protein levels as determined by the BCA assay. N = 3 for each data point. (j) Quantification of the maximum respiration and spare respiratory capacity in (i). N = 3. Data are presented as mean ±SEM. Significance determined by Student's t test or one‐way ANOVA with Tukey's multiple comparisons test. ns, not significant, *p < 0.05, **p < 0.01, ***p < 0.001, ****p < 0.0001
