FIGURE 5.

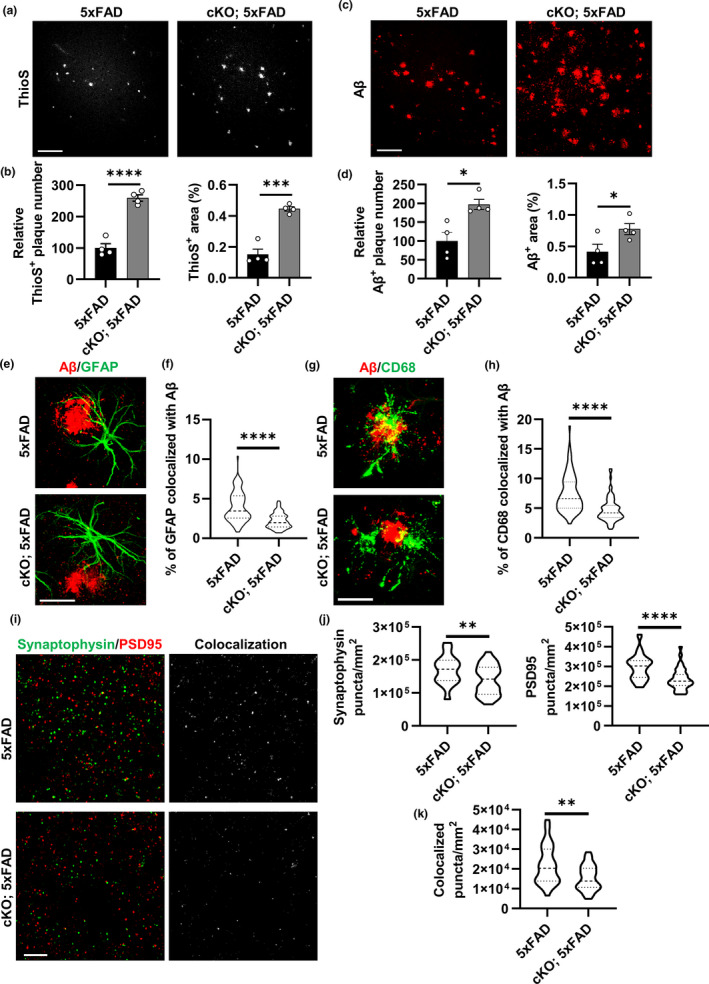
Loss of FoxO3 aggravates amyloid pathology and alters glial behaviors in 5xFAD mice. (a) Representative confocal images showing amyloid plaques in the cortex by Thioflavin S staining in 3.5‐month‐old Foxo3 cKO; 5xFAD and 5xFAD mice. Scale bar: 100 μm. (b) Quantification of Thioflavin S‐positive plaque number and percentage area in the cortex. N = 4. (c) Representative confocal images showing amyloid plaques in the cortex by Aβ immunostaining in FoxO3 cKO; 5xFAD and 5xFAD mice. Scale bar: 100 μm. (d) Quantification of Aβ‐positive plaque number and percentage area in the cortex. N = 4. (e) Representative confocal images showing amyloid plaques and plaque‐associated reactive astrocytes via Aβ and GFAP co‐staining in Foxo3 cKO; 5xFAD and 5xFAD mice. Scale bar: 30 μm. (f) Quantification of percentage of GFAP‐positive volume colocalized with Aβ in (e) using IMARIS software. N = 75. (g) Representative confocal images showing amyloid plaques and phagocytic microglia via Aβ and CD68 co‐staining in Foxo3 cKO; 5xFAD and 5xFAD mice. Scale bar: 20 μm. (h) Quantification of percentage of CD68‐positive volume colocalized with Aβ in (g) using IMARIS software. N = 75. (i): Representative confocal images of immunofluorescent co‐staining of Synaptophysin and PSD95 in Foxo3 cKO; 5xFAD and 5xFAD mice. Colocalized signals from two channels were also shown. Scale bar: 10 μm. (j) Quantification of the average number of Synaptophysin‐positive puncta and PSD95‐positive puncta per mm2 in (i). N = 36. (k) Quantification of the average number of Synaptophysin and PSD95 colocalized puncta number per mm2 in (i). N = 36. Male mice at 3.5 months of age were used in all analyses. Data are presented as mean ±SEM. Significance determined by Student's t test. *p < 0.05, **p < 0.01, ***p < 0.001, ****p < 0.0001
