FIGURE 6.

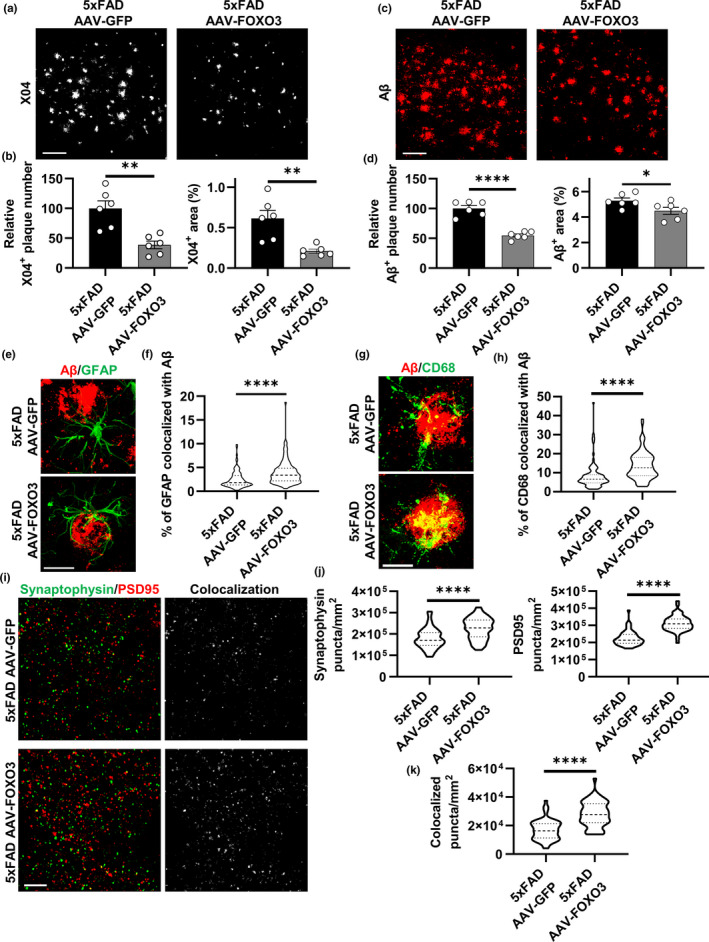
Astrocytic FoxO3 expression mitigates the pathological phenotypes in 5xFAD mice. (a) Representative confocal images showing amyloid plaques in the cortex by X04 staining of 5‐month‐old 5xFAD mice with AAV‐GFP or AAV‐FOXO3 injections. Scale bar: 100 μm. (b) Quantification of X04‐positive plaque number and percentage area in the cortex. N = 6. (c) Representative confocal images showing amyloid plaques in the cortex by Aβ staining of 5xFAD mice with AAV‐GFP or AAV‐FOXO3 injections. Scale bar: 100 μm. (d) Quantification of Aβ‐positive plaque number and percentage area in the cortex. N = 6. (e) Representative confocal images showing amyloid plaques and plaque‐associated reactive astrocytes via Aβ and GFAP co‐staining of 5xFAD mice with AAV‐GFP or AAV‐FOXO3 injections. Scale bar: 30 μm. (f) Quantification of percentage of GFAP‐positive volume colocalized with Aβ in (e) using IMARIS software. N = 90. (g) Representative confocal images showing amyloid plaques and phagocytic microglia via Aβ and CD68 co‐staining of 5xFAD mice with AAV‐GFP or AAV‐FOXO3 injections. Scale bar: 20 μm. (h) Quantification of percentage of CD68‐positive volume colocalized with Aβ in (g) using IMARIS software. N = 90. (i) Representative confocal images of immunofluorescent co‐staining of Synaptophysin and PSD95 of 5xFAD mice with AAV‐GFP or AAV‐FOXO3 injections. Colocalized signals from two channels were also shown. Scale bar: 10 μm. (j) Quantification of the average number of Synaptophysin‐positive puncta and PSD95‐positive puncta per mm2 in (i). N = 54. (k): Quantification of the average number of Synaptophysin and PSD95 colocalized puncta number per mm2 in (i). N = 54. Female mice at 5 months of age were used in all experiments. Data are presented as mean ±SEM. Significance determined by Student's t test. *p < 0.05, **p < 0.01, ****p < 0.0001
