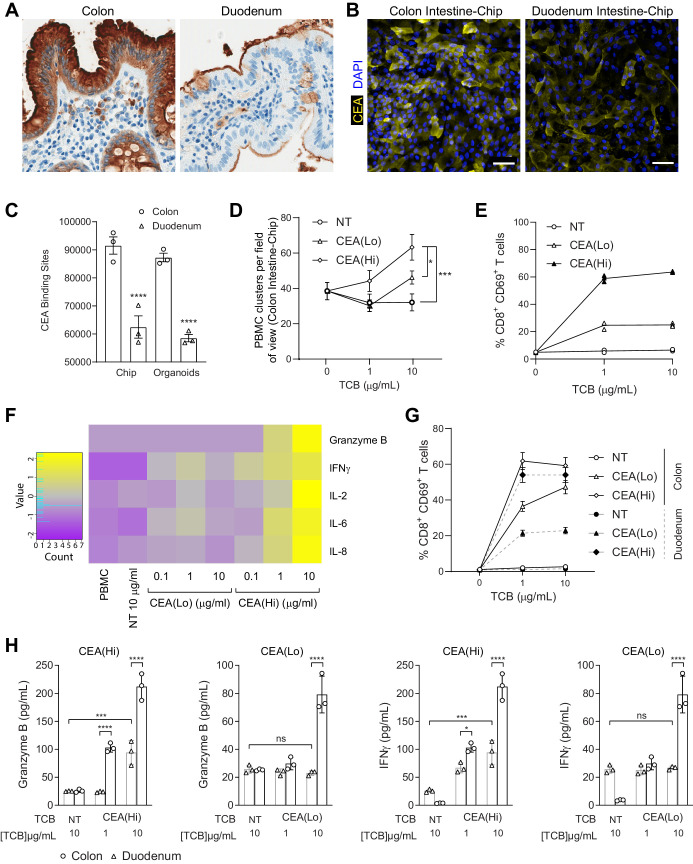
Figure 4. Application of colon intestine-Chip as model of CEA-TCB-mediated adverse effects.
(A) IHC of human colon and duodenum tissue stained with anti-CEA (brown coloration) demonstrating difference in regional expression. (B) Representative immunofluorescent micrograph depicting CEA expression in the epithelial compartment of the Colon Intestine-Chip and Duodenum Intestine-Chip. (C) Average cell surface expression of CEA within 3D organoids and chips at day 8 of culture (n=3). (D) Colon-Chip epithelial channels were administered with PBMC treated with/without low and high-affinity (CEA(Lo) and CEA(Hi)) TCB (0.1–10 µg/mL), or Non-targeting (NT) TCB (10 µg/mL). Co-culture was maintained under flow for 72 hr. Quantification of immunofluorescent images collected live indicate multiple clusters of PBMC settled throughout epithelial structures. Statistical analysis was conducted by one-way ANOVA and was defined as *p<0.05 and ***p<0.001. Errors bars represent ± SEM. (E) CD69+ Activation of CD8+ T cells of harvested PBMC measured by flow-cytometry (n=3± SEM). (F) Heat map of multiplex cytokine panel from epithelial channel supernatants. Data (D–F) from terminal endpoint 72 hr after administration (n=3). (G) Colon- and Duodenum-Chips were administered with PBMC with low and high-affinity (CEA(Lo) and CEA(Hi)) TCB treatment from 0 to 10 µg/mL, along with Non-targeting (NT) control. Flow cytometry analysis of harvested PBMC from chips 72 hr post-treatment to measure levels of activated CD69+CD8+ T cells (n=3± SEM). (H) Multiplex cytokine analysis of supernatant collected from epithelial channels of Colon and Duodenum-Chips after 72 hr of treatment (n=3± SEM).


