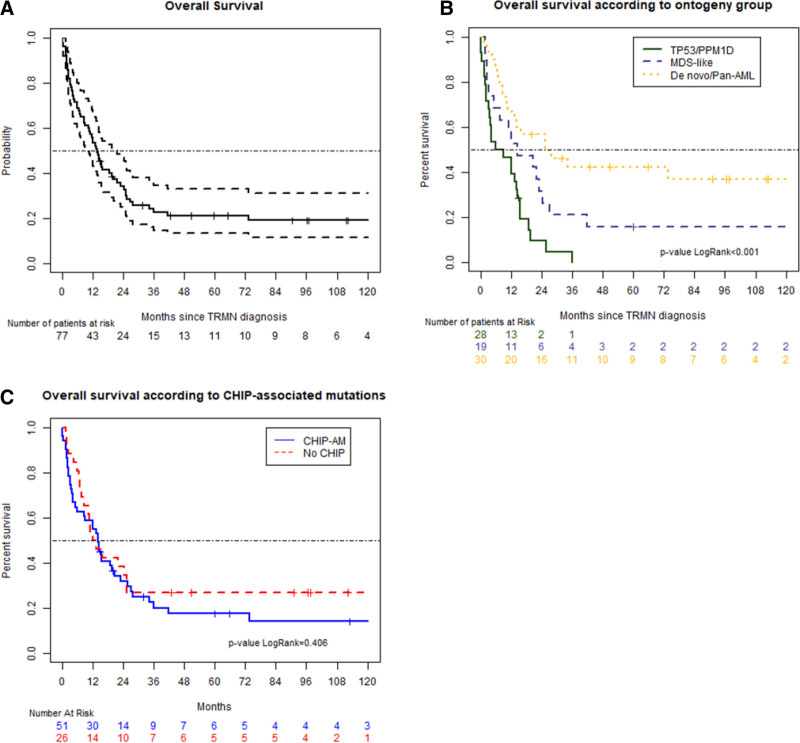
Figure 2.
Survival curves. OS of the whole cohort (A), dot lines represent 95% CI. OS according modified genetic ontogeny-based classifier groups described by Lindsley et al. (B), curves show patients with “de novo/pan-AML” (yellow), “MDS-like” (blue), and “TP53/PPM1D” (green) mutations. OS according to CHIP-AM groups (C), blue line represents CHIP–AM patients, red line No CHIP-AM patients. AML = acute myeloid leukemia; CHIP-AM = clonal hematopoiesis of indeterminate potential-associated mutations; CI = confidence interval; MDS = myelodysplastic syndrome; OS = overall survival.

