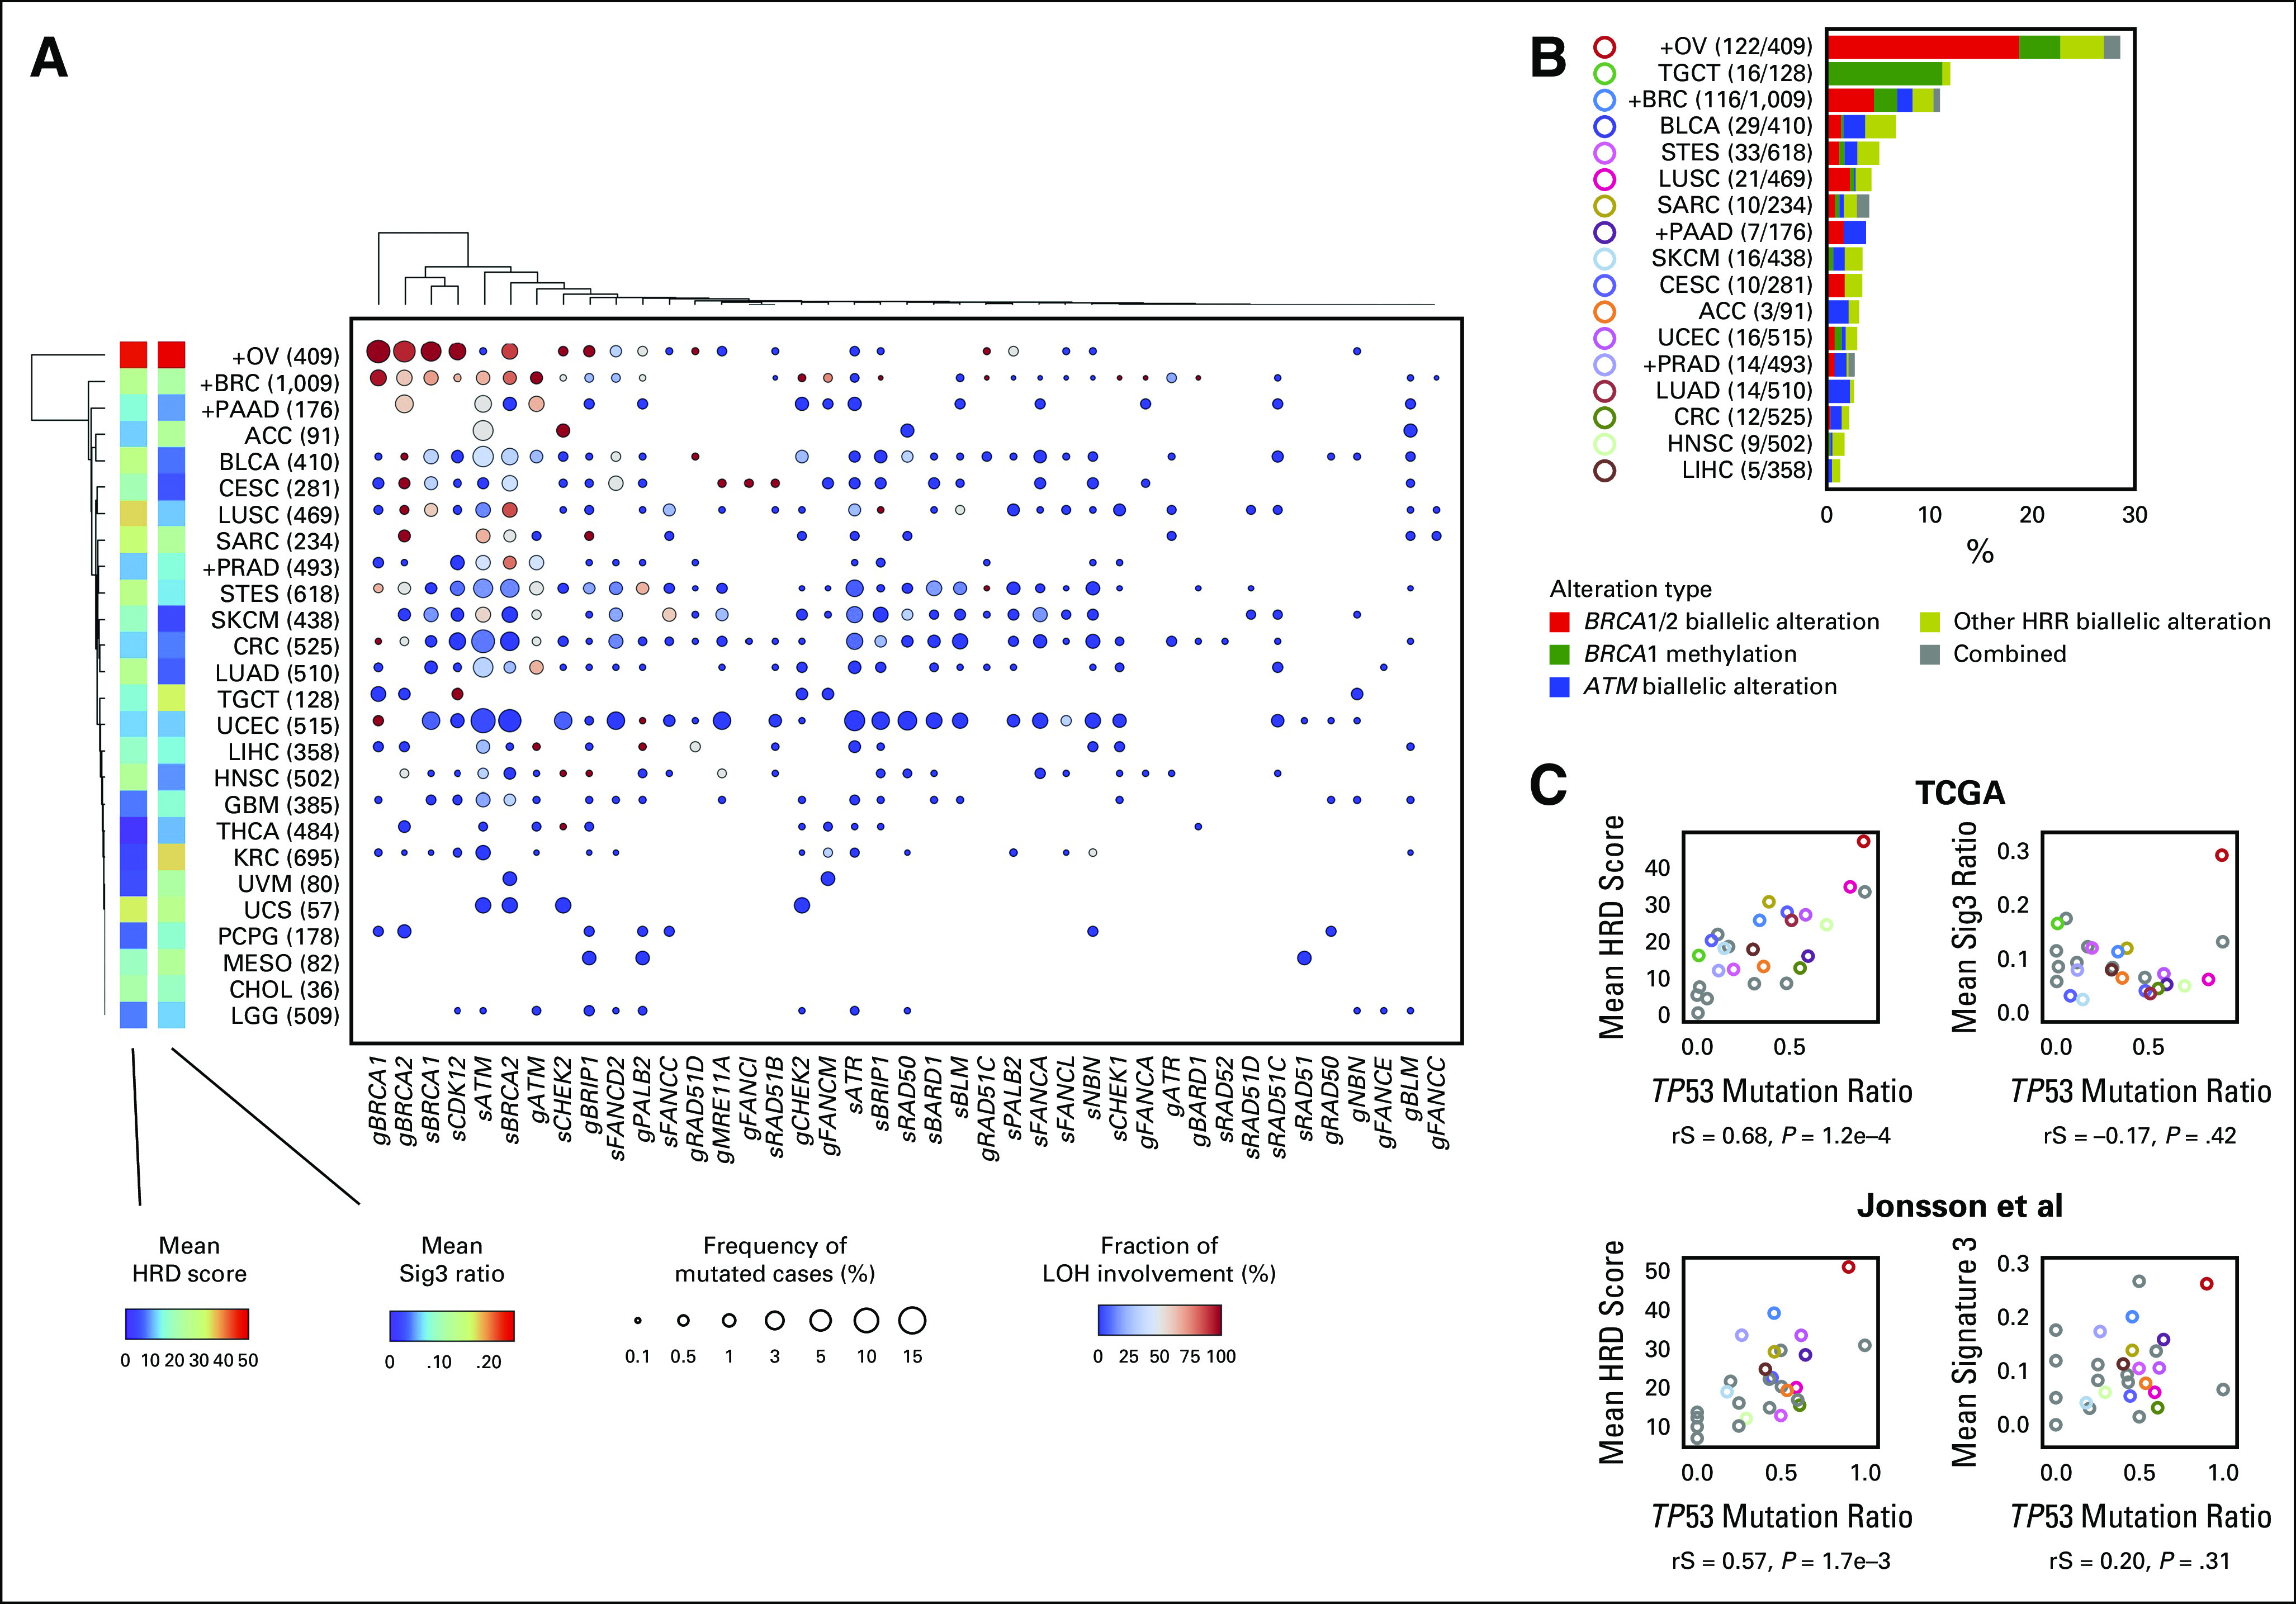
FIG 2.

Detailed HRR pathway gene alterations per cancer type. (A) For each cancer type and HRR pathway gene, the percentage of samples with gene mutation detected and with LOH detected are annotated using size and color. The product of these two values is input to hierarchical clustering to generate the resulting type-gene ordering. Cancer types annotated with a + mark are BRCA-associated cancers, and values indicate number of cases in TCGA. (B) Types and proportions of biallelic HRR pathway gene alterations per cancer type. (C) Correlation between TP53 mutation ratio with mean HRD score (left) and mean Sig3 ratio (right) by cancer type. Upper and lower panels are from the TCGA and Jonsson et al data sets, respectively. Colors are identical to B, or otherwise gray. rS and P represent the Spearman correlation coefficient and its P value, respectively. HRD, homologous recombination DNA repair deficiency; HRR, homologous recombination repair; LOH, loss of heterozygosity; Sig3, signature 3; TCGA, The Cancer Genome Atlas.
