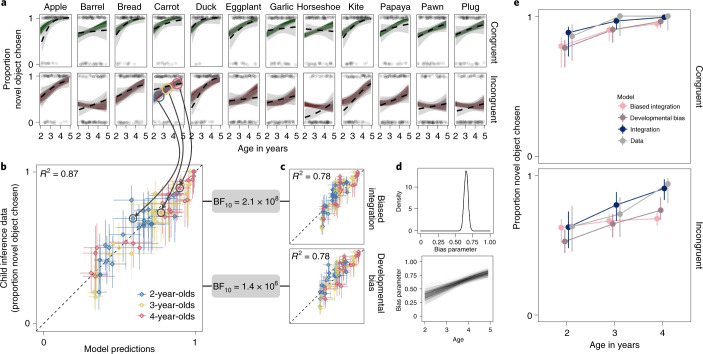
Fig. 3. Explaining information integration.
a, Model predictions from the rational-integration model (coloured lines) next to the behavioural data (dotted black lines with 95% CI in grey) for all 24 experimental conditions. Top row shows the congruent condition, while bottom row shows the incongruent condition. Familiar objects are ordered on the basis of their rated age of acquisition (left to right). Light dots represent individual data points. b,c, Correlations between model predictions binned by age and condition for the integration model (b) and the two biased models (c). Vertical and horizontal error bars show 95% HDIs. BF10 gives the Bayes factor in favour of the rational-integration model on the basis of the marginal likelihood of the data under each model. d, Posterior distribution of the bias parameter in the biased-integration model and developmental trajectories for the bias parameter in the developmental-bias model. e, Predictions from all models considered alongside the data (with 95% HDI) for two experimental conditions (familiar word: “duck”).

