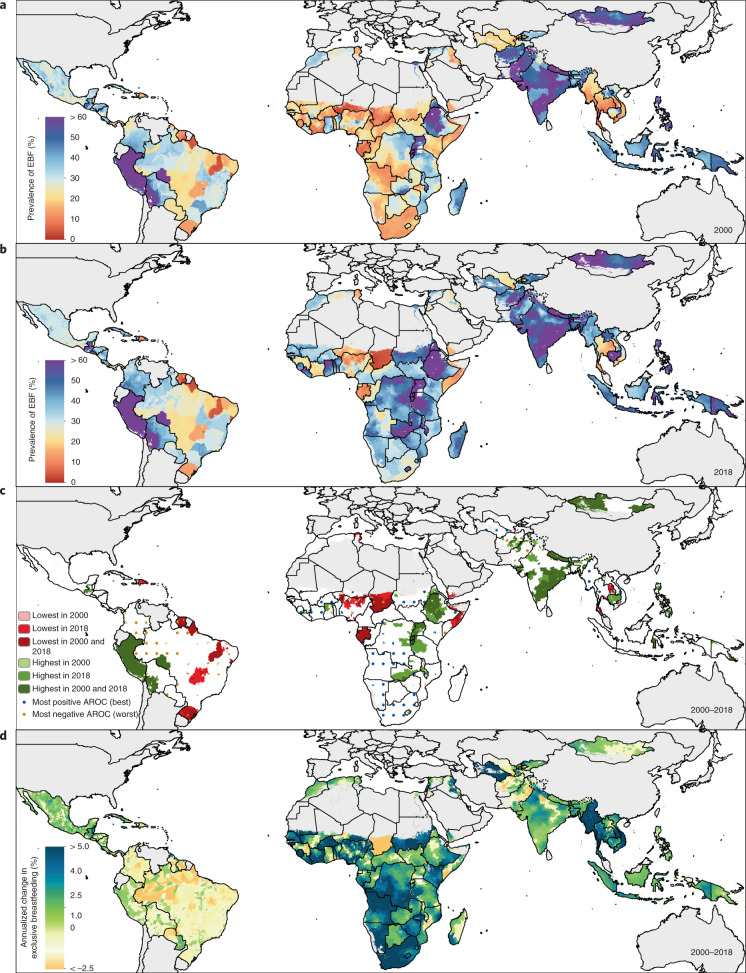
Fig. 1. EBF prevalence and progress (2000–2018) among infants under 6 months across LMICs.
a,b, Prevalence of EBF practices at the district level in 2000 (a) and 2018 (b). c, Overlapping population-weighted highest and lowest deciles of prevalence and weighted AROC between 2000 and 2018, at the district level. d, Weighted annualized percentage change in EBF prevalence between 2000 and 2018. Maps reflect administrative boundaries, land cover, lakes and population; grey-coloured grid cells had fewer than ten people per 1 × 1-km grid cell and were classified as ‘barren or sparsely vegetated’ or were not included in this analysis50–55.

