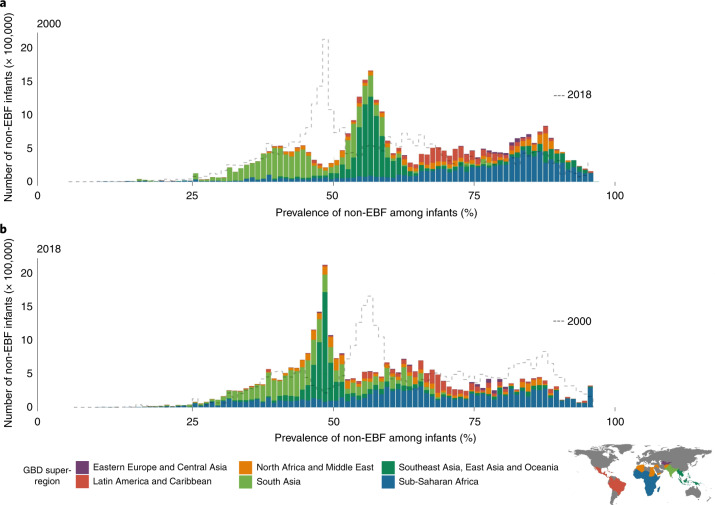
Fig. 4. Number of infants under 6 months who are not being exclusively breastfed, distributed across non-EBF prevalence in 2000 and 2018, across 94 countries.
a, Non-EBF infants under 6 months in 2000. b, Non-EBF infants under 6 months in 2018. The dotted line in the 2000 plot is the shape of the distribution in 2018 and the dotted line in the 2018 plot represents the distribution in 2000. Bar heights represent the total number of infants under 6 months who were not exclusively breastfed by district-level units, with corresponding non-EBF prevalence. Bins are a width of one non-EBF infant per 100 infants. The colour of each bar represents the global region as defined by the subset legend map. As such, the sum of heights of all bars represents the total number of non-EBF infants across the 94 countries.

