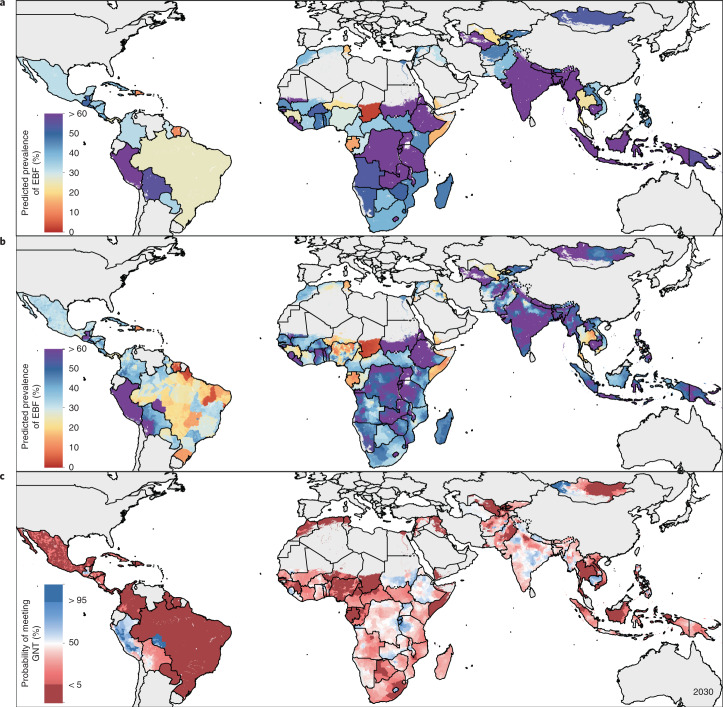
Fig. 6. Projected prevalence for EBF for 2030 and probability of meeting the ≥70% WHO GNT by 2030.
a,b, Projected EBF prevalence for 2030 at the national (a) and district (b) levels. c, Probability of meeting the WHO GNT of at least 70% EBF prevalence by 2030 at the district level. Dark blue indicates a high probability (>95% posterior probability) and dark red indicates a low probability (<5% posterior probability) of meeting the WHO GNT by 2030. Maps reflect administrative boundaries, land cover, lakes and population; grey-coloured grid cells had fewer than ten people per 1 × 1-km grid cell and were classified as ‘barren or sparsely vegetated’ or were not included in this analysis50–55.

