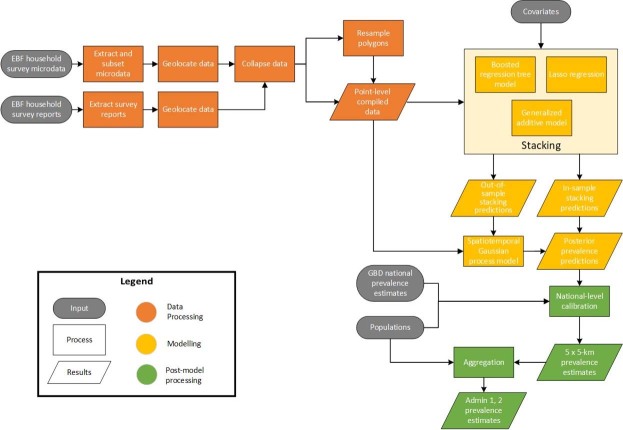
Extended Data Fig. 1. Analytic process overview.
The process used to produce EBF prevalence estimates across LMICs involved three main parts. In the data-processing steps (orange), data were identified, extracted, and prepared for use in the models. In the modelling phase (yellow), we used these data and covariates in stacked generalization ensemble models and spatiotemporal Gaussian process models for each EBF indicator. In post-processing (green), we calibrated the prevalence estimates to match the GBD 201912 study estimates and aggregated the estimates to the first- and second-administrative levels in each country.

