
Extended Data Fig. 2. National time series plots and aggregated input data.
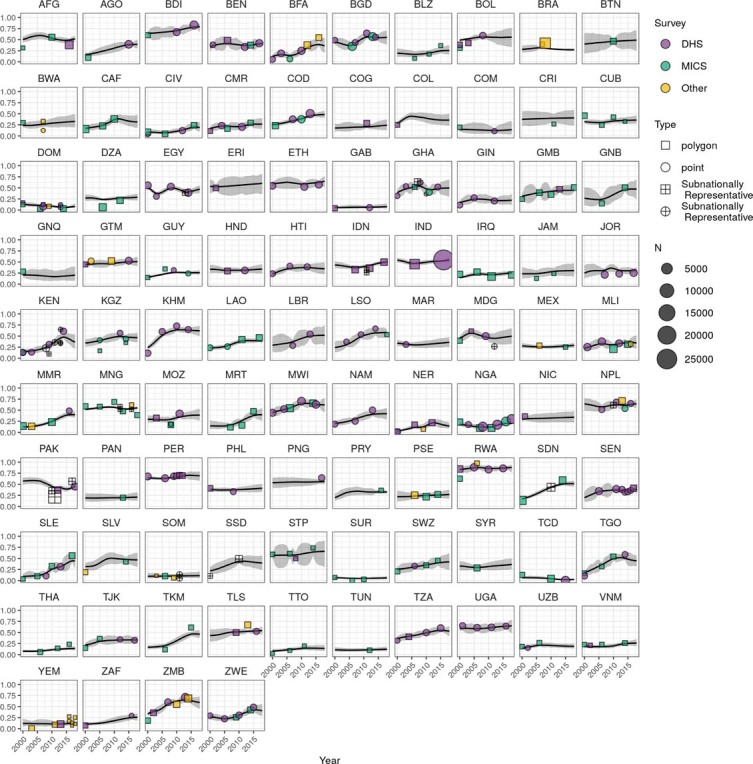
National time series plots of the post-GBD calibration final estimates by country during 2000–2018. Uncertainty ranges are presented in grey, and aggregated input data are classified by survey series (purple for country-specific, green for DHS, and yellow for MICS surveys), data type (square for polygon, circle for point data), and whether the survey is nationally or subnationally representative).