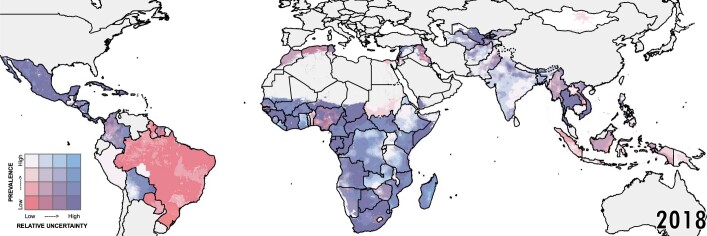
Extended Data Fig. 3. Relative uncertainty in EBF estimates for 2018.
Relative uncertainty in second-administrative-level estimates compared with mean estimated EBF prevalence in each second-administrative-level unit for 2018. Mean prevalence and relative uncertainty are split into population-weighted quartiles. These cut-off points for relative uncertainty (calculated as the absolute range of the uncertainty intervals divided by the estimate) are 0.684 (25th percentile), 0.916 (50th percentile), and 1.271 (75th percentile), respectively. The cut-off points for EBF prevalence are 25.8% (25th percentile), 35.4% (50th percentile), and 49.4% (75th percentile), respectively. Units in which our estimates are more uncertain are coloured with a scale of increasing blue hue, whereas areas in which the mean estimates of EBF are low are coloured with a scale of increasing red hue. Purple areas have low, but uncertain, estimates of EBF. White areas have high EBF estimates that are fairly certain. Relative uncertainty is defined as the ratio of the width of the 95% uncertainty interval to mean estimate. Maps reflect administrative boundaries, land cover, lakes, and population; grey-coloured grid cells had fewer than ten people per 1 × 1-km grid cell and were classified as ‘barren or sparsely vegetated’, or were not included in this analysis50–55.

