
FIGURE 5.
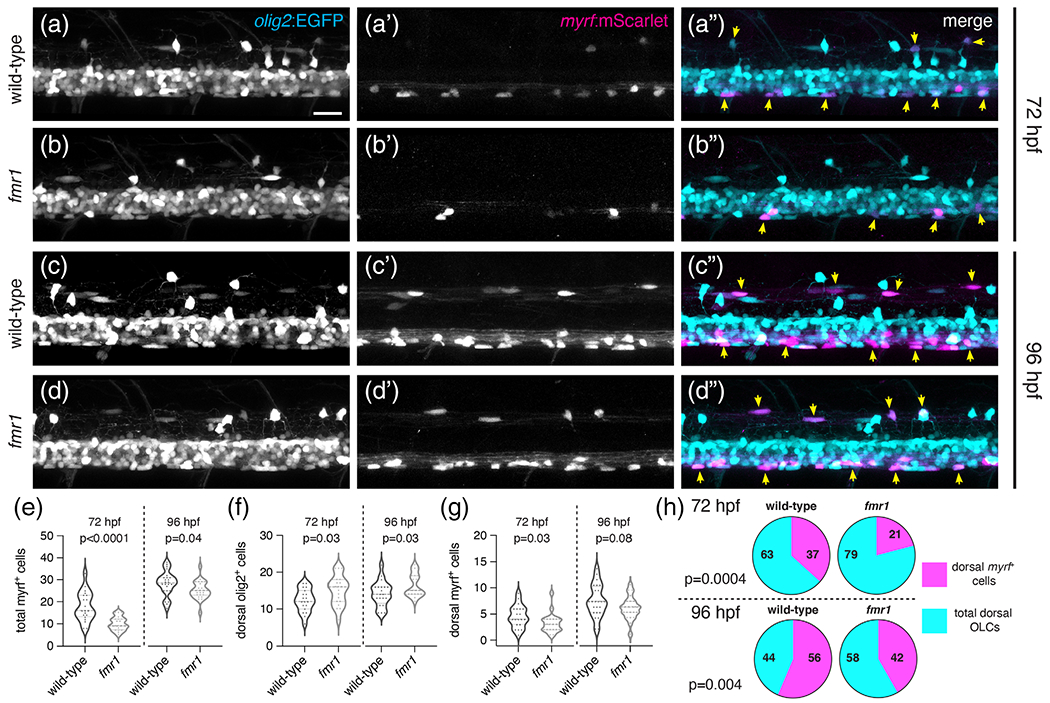
Fmrp regulates the timing of OL differentiation. Representative lateral images of live transgenic wild-type and fmr1 mutant larvae at 72 hpf (a, b) and 96 hpf (c, d) stably expressing olig2:EGFP (pMNderived cells) and myrf:mScarlet (differentiating oligodendrocytes). Yellow arrowheads indicate olig2+myrf+ cells. Graphs comparing the quantity of total myrf+ cells (e; n72hpf = 20 larvae each, n96hpf = 24WT,23fmr1), dorsal OLCs (f; n72hpf = 19 each, n96hpf = 20WT,23fmr1), dorsal myrf+ cells (G; n72hpf = 20 each, n 96hpf = 24WT,23fmr1), and the ratio of differentiating dorsal OLCs (h; n72hpf = 19 each, n96hpf = 20WT,22fmr1). Significance determined by a Mann–Whitney tests (g, 72 hpf) and unpaired t tests (all others). Scale bar = 20 μm [Color figure can be viewed at wileyonlinelibrary.com]