
FIGURE 6.
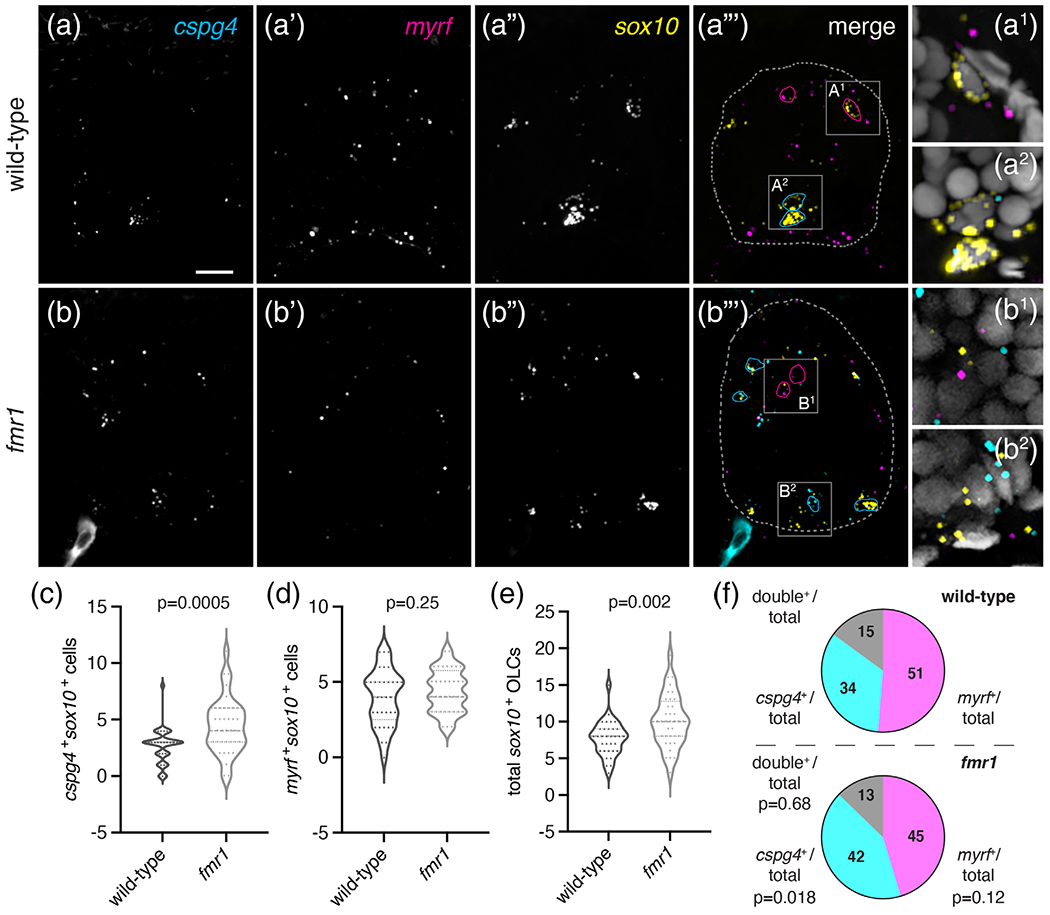
fmr1 mutant larvae have excess OPCs. Representative images of transverse trunk spinal cord sections of wild-type (a–a‴) and fmr1 mutant (b–b‴) larvae processed to detect expression of cspg4, myrf, and sox10 at 6 dpf via fluorescent in situ RNA hybridization. (a‴, b‴) sox10+myrf+cspg4− cells are outlined in magenta; cspg4+ cells not expressing myrf in cyan; spinal cord boundaries in dashed lines. (a1, a2) and (b1, b2) show high magnification insets from a‴ and b‴, respectively, and include DAPI nuclear stain. Graphs comparing myrf+ OLCs (c), cspg4+ OLCs (d), and total sox10+ cells in wild-type (n = 8 larvae, 33 sections) and fmr1 mutants (n = 8 larvae, 36 sections). (f) Relative ratios of OLCs expressing myrf, cspg4, or coexpressing both transcripts. Significance determined by unpaired t tests (total sox10+, myrf+ comparisons) and Mann–Whitney tests (double+ ratio, cspg4+ comparisons). Scale bar = 10 μm [Color figure can be viewed at wileyonlinelibrary.com]