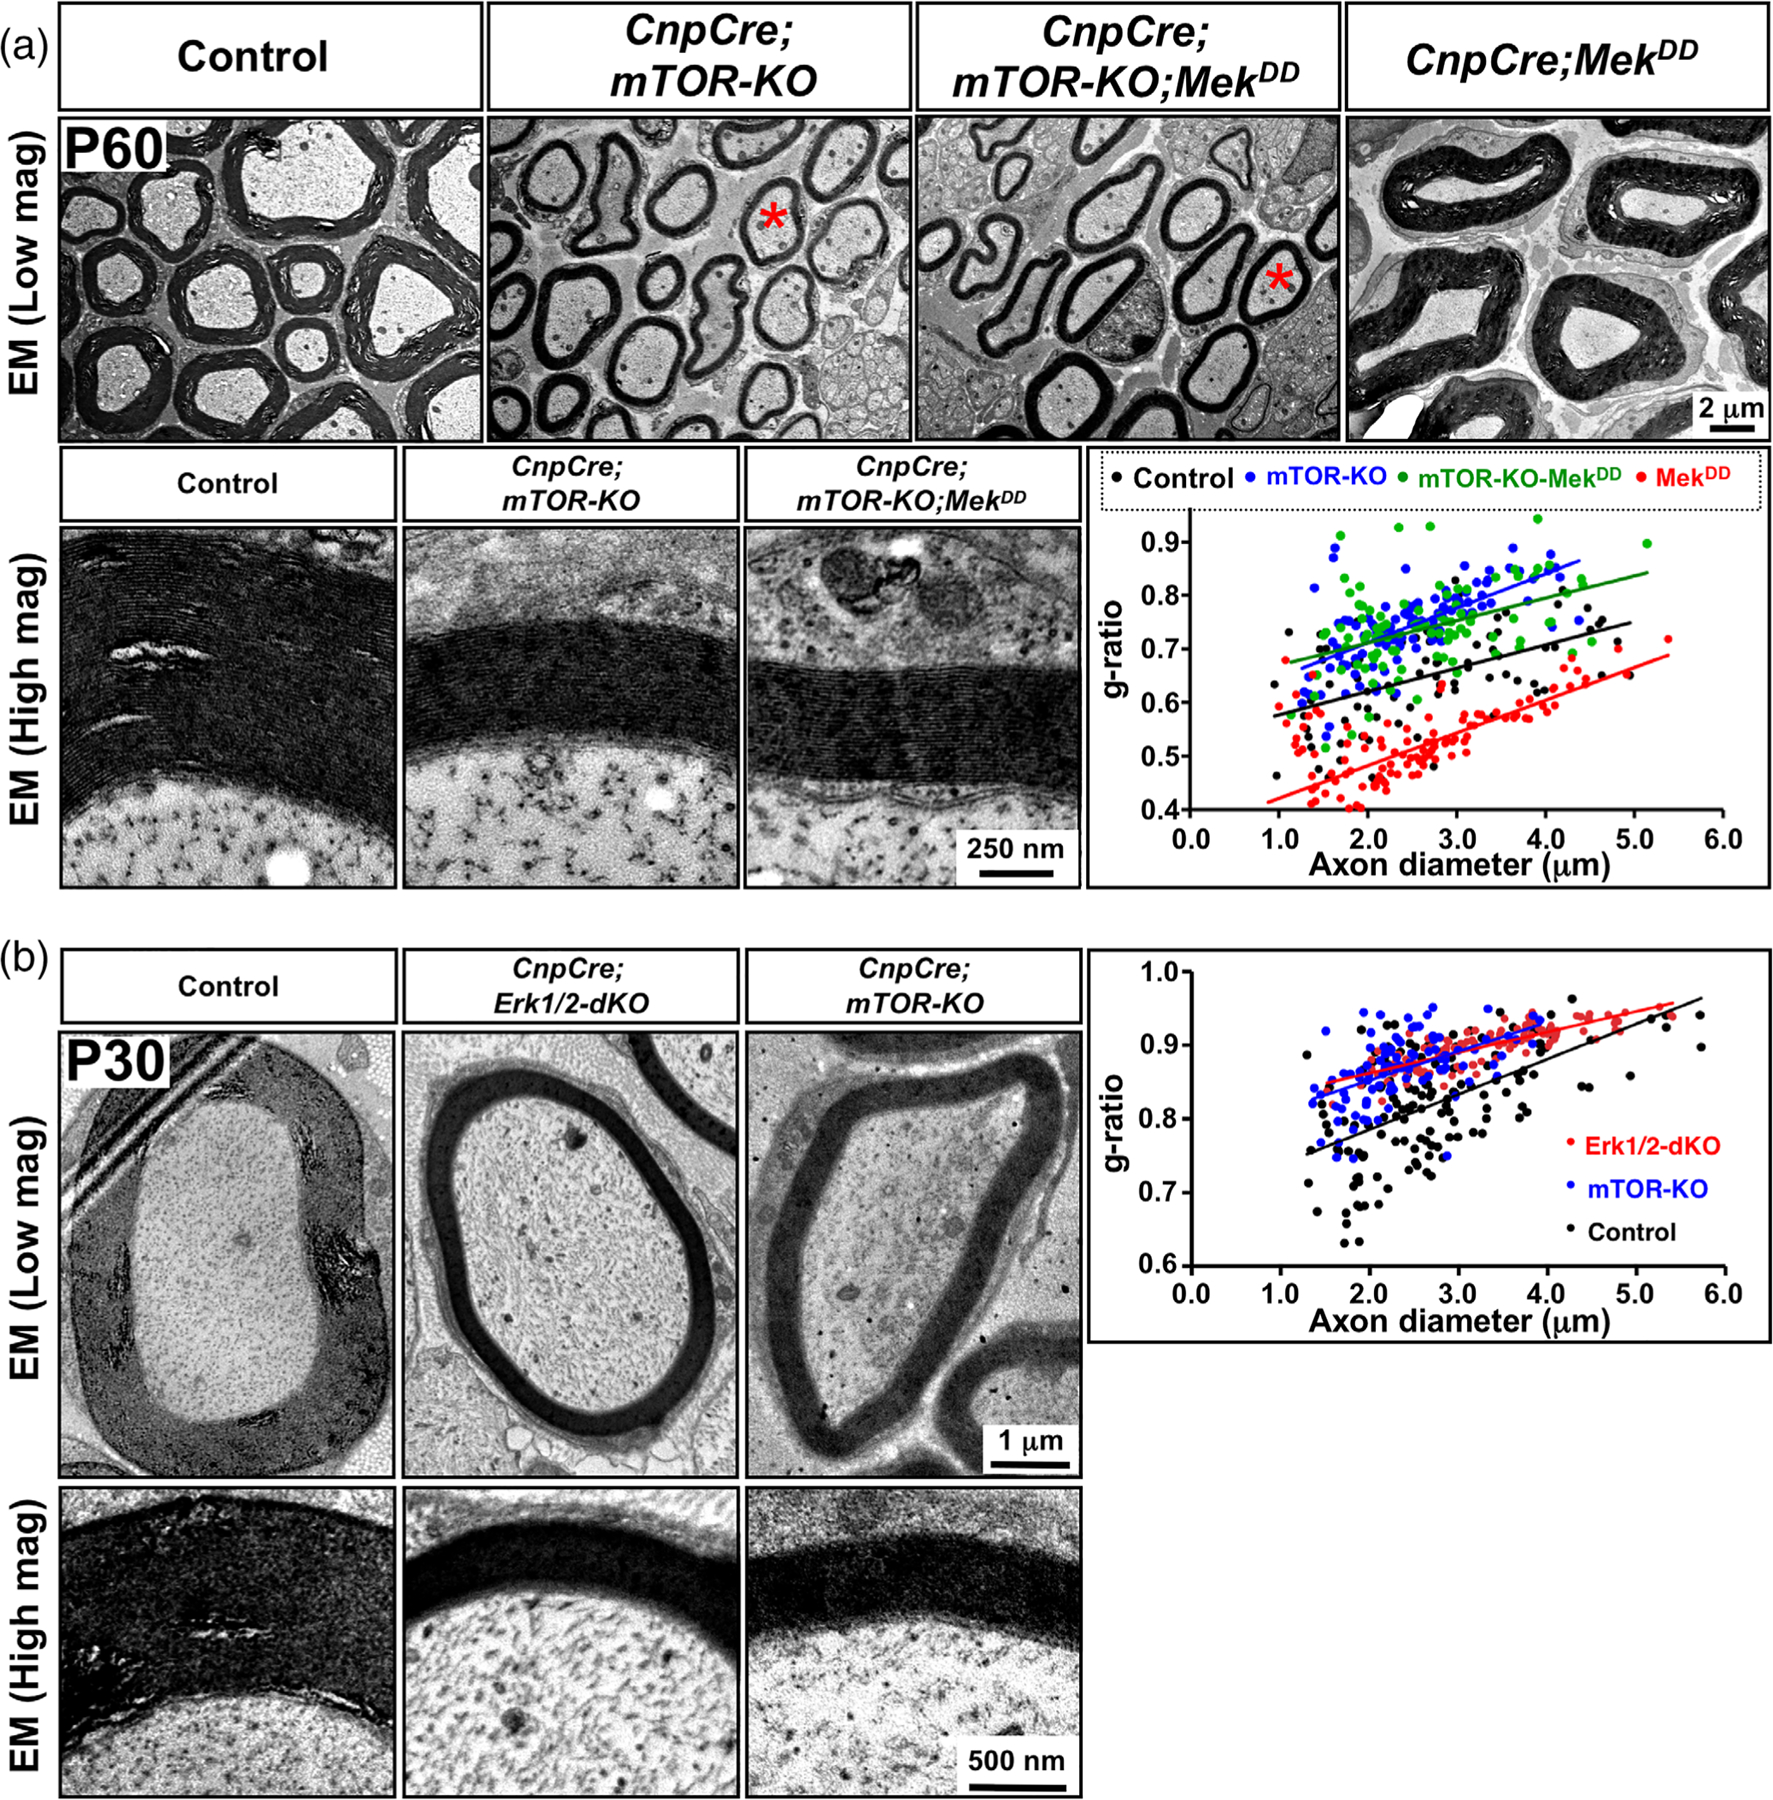
FIGURE 3.

Sustained elevation of ERK1/2 activity in Schwann cells failed to rescue the deficits in myelin thickness in the mTOR KO mice. (a) EM images of sciatic nerve cross-sections at low and high magnification show reduced myelin thickness in the CnpCre;mTOR-KO compared to control, which was not rescued by ERK1/2 elevation in the CnpCre;mTOR-KO;MekDD mice, even though its elevation increases myelin thickness in CnpCre;MekDD compared to control mice. Quantification of myelin thickness by g-ratio analysis, presented as scatter plots relative to axon diameters, indicates that compared to control (black dots), both CnpCre;mTOR-KO (blue dots) and CnpCre;mTOR-KO;MekDD (green dots) show reduced myelin thickness (higher g-ratios), while CnpCre;MekDD mice (red dots) show thicker myelin sheaths compared to controls (lower g-ratios). (b) EM images of sciatic nerve cross-sections at low and high magnification at P30 also show that the thickness of myelin in the CnpCre; ERK1/2-dKO mice is thinner than in the control, but is similar to the CnpCre;mTOR-KO mice. Approximately 100 axons from two mice of each genotype were analyzed. Scale bar as indicated. Red asterisks in (a), shows axons of similar diameter [Color figure can be viewed at wileyonlinelibrary.com]
