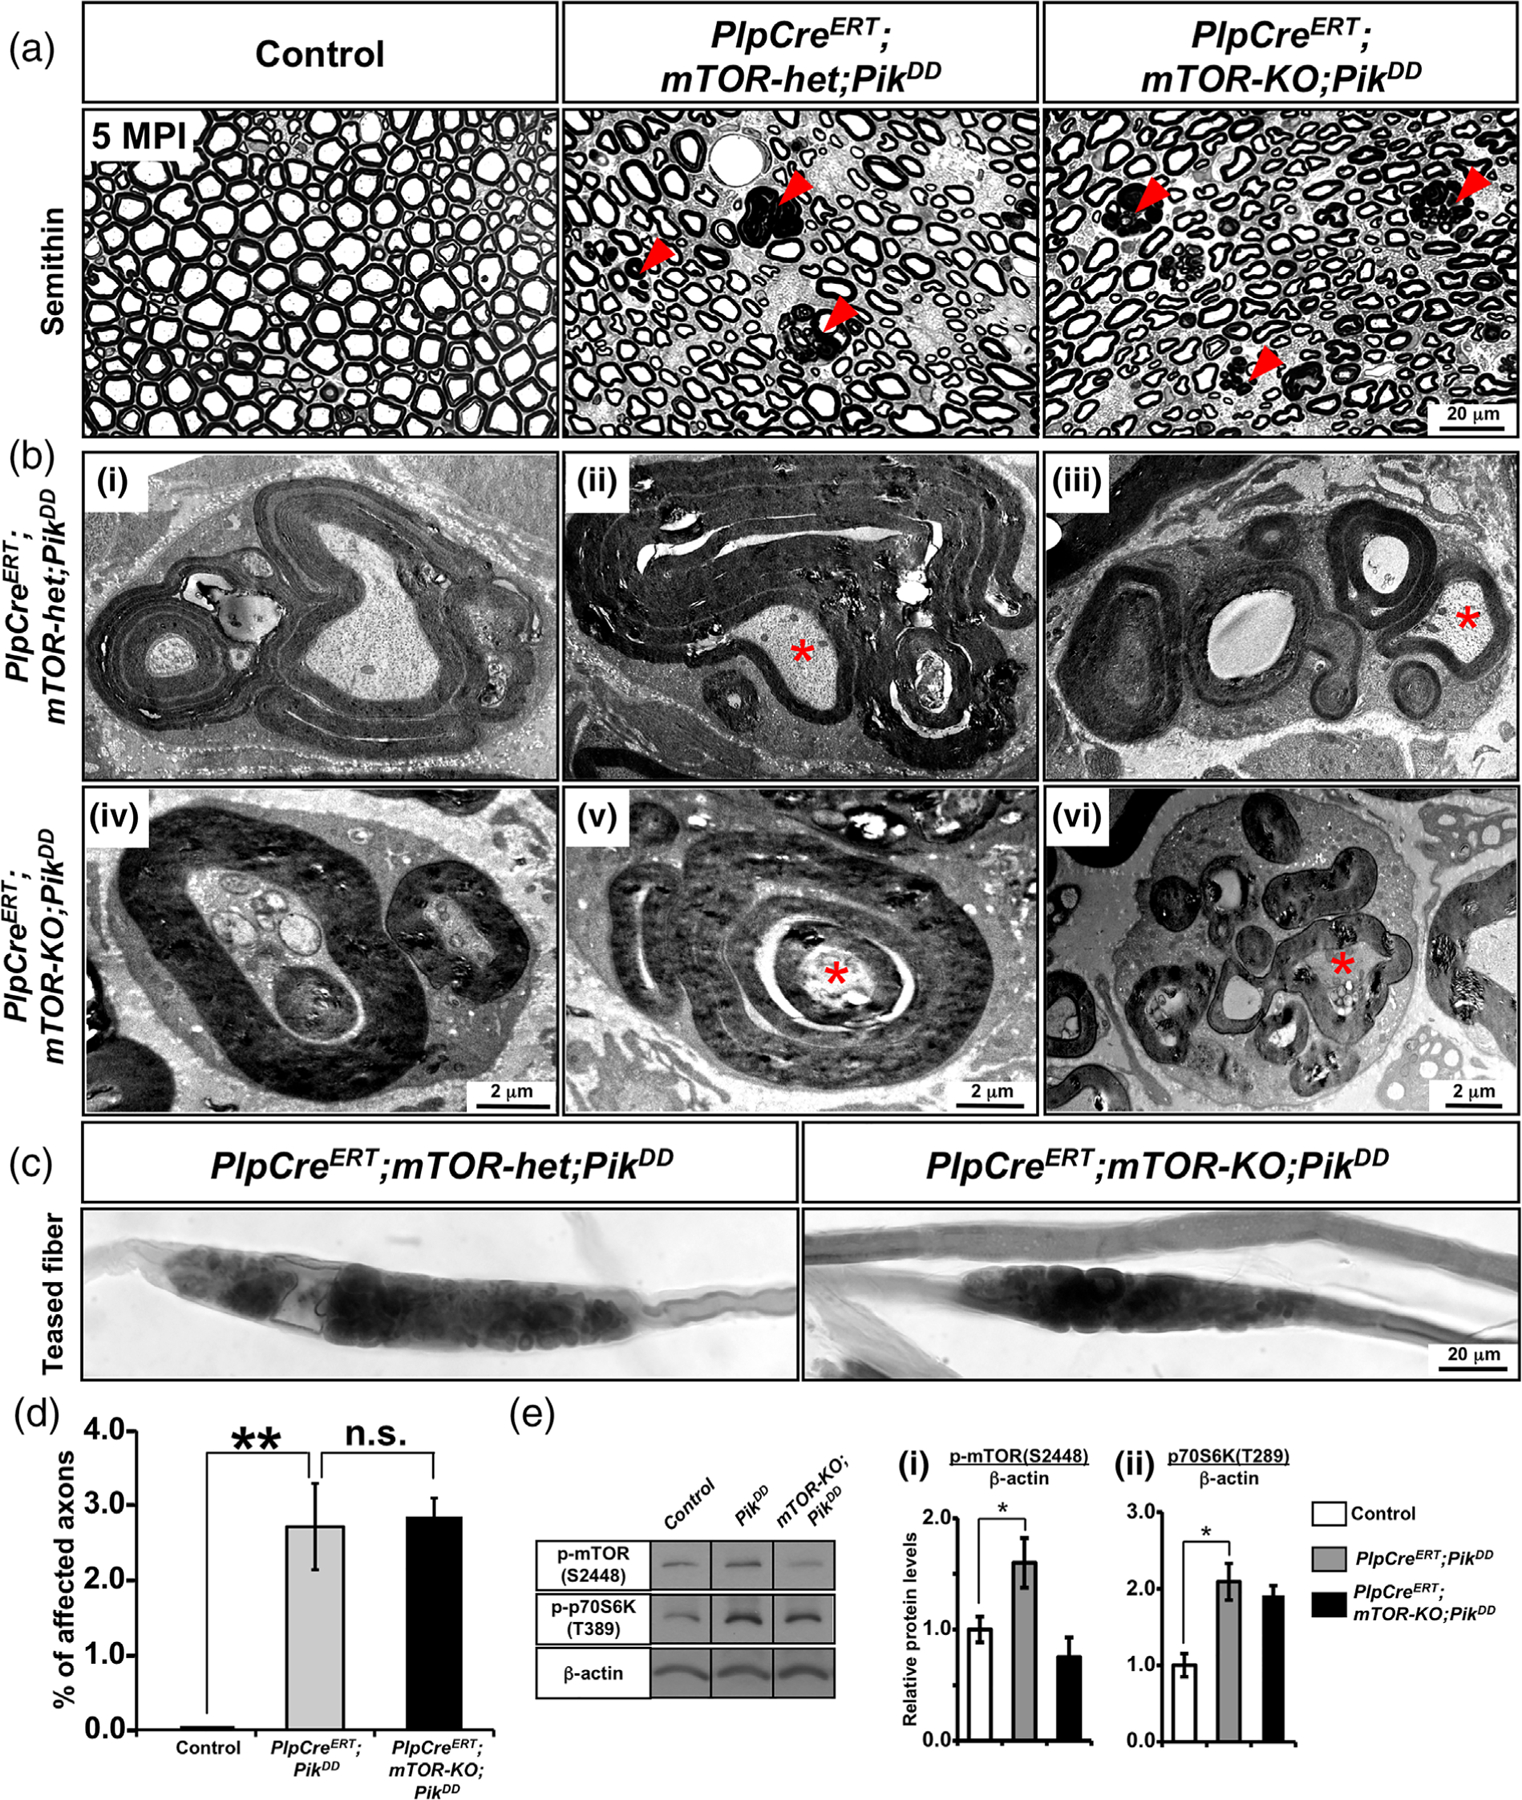
FIGURE 6.

PI3K-mediated pathology was also not abrogated when mTOR was simultaneously ablated during adulthood from myelinating Schwann cells. (a) Semithin sections of sciatic nerves from control, PlpCreERT;mTOR-het;PikDD, and PlpCreERT;mTOR-KO;PikDD mice injected with Tm at 1 month of age and analyzed at 5 months postinjection (MPI) show numerous abnormal myelin figures (red arrowheads) in both the PlpCreERT;mTOR-het;PikDD and PlpCreERT;mTOR-KO;PikDD mice but not in the controls. (b) EM images at higher magnification show presence of abnormalities in both the PlpCreERT;mTOR-het;PikDD (i–iii) and PlpCreERT;mTOR-KO;PikDD (iv–vi), which includes (i,iv) myelin out-foldings with evaginating recurrent loops, (ii,v) redundant myelin, constricting and displacing the axon, and (iii,vi) multiple evaginating recurrent loops that appear as Schwann cell ensheathing multiple small-diameter axons. (c) Teased fiber preparation from sciatic nerve shows focal myelin thickening with abnormal structures in both the PlpCreERT;mTOR-het;PikDD and PlpCreERT;mTOR-KO;PikDD mice. Scale bar as indicated. Asterisks, axonal abnormalities. Representative images of sciatic nerves from 2–3 mice per genotype are shown. (d) Quantification of abnormal myelin figures in seminthin sections of sciatic nerves from mice at 5 MPI show a statistically significant increase in the percentage of affected axons in the PlpCreERT;mTOR-het;PikDD mice compared to control mice which failed to be rescue in the PlpCreERT;mTOR-KO;PikDD mice. Ten fields at 100x per genotype were analyzed from at least 2–3 mice per group. Error bars indicate SEM. **p < .01, one-way ANOVA. (e) Immunoblot analysis and quantification for p-mTORS2448 and p-p70S6KT389 levels in total protein homogenates from sciatic nerve at 2MPI shows a significant increase in p-mTORS2448 and p-p70S6KT389 levels in the PlpCreERT;PikDD mice compared to controls. While ablation of mTOR showed reduction trend of p-mTORS2448 levels in the PlpCreERT;mTOR-KO;PikDD compared to PlpCreERT;PikDD mice, the levels of p-p70S6KT389 did not show such a trend. β-Actin was used as a loading control. N = 3 for control and PlpCreERT;PikDD and N = 2 for PlpCreERT;mTOR-KO;PikDD. Error bars indicate SEM. *p < .05, Student’s t-test [Color figure can be viewed at wileyonlinelibrary.com]
